Tag: Calculator
Conditionals in the QGIS raster calculator
I needed to do some conditionals in the QGIS raster calculator, but it doesn’t support that—or at least doesn’t seem to. But it does support logical operators, with a result of either 0 or 1. For instance, here’s the script I wrote:
# Subtract them
((DavisQuad2012-02-25T16_00_00Z@1  -  DavisQuad2012-02-29T16_00_00Z@1)*
# Multiply by 1 if neither is 255 (NoData), 0 otherwise
(DavisQuad2012-02-25T16_00_00Z@1 != 255 AND DavisQuad2012-02-29T16_00_00Z@1 != 255))
# Subtract 32768 if either one was NoData, giving us -32768 for NoData.
-
(32768*(DavisQuad2012-02-25T16_00_00Z@1 = 255 OR DavisQuad2012-02-29T16_00_00Z@1 = 255))
Of course, you can’t actually put the comments in. But what it does is this: First, I subtract one raster from the other and multiply that by the logical operation that neither one contains NoData. That gives me the difference of the rasters, or 0 if either one contains NoData. Then I subtract 32768 multiplied by the inverse of the aforementioned logical operation, so any pixel with a NoData value in either of the original rasters is -32768 in the new one.
Tag: Conditionals
Conditionals in the QGIS raster calculator
I needed to do some conditionals in the QGIS raster calculator, but it doesn’t support that—or at least doesn’t seem to. But it does support logical operators, with a result of either 0 or 1. For instance, here’s the script I wrote:
# Subtract them
((DavisQuad2012-02-25T16_00_00Z@1  -  DavisQuad2012-02-29T16_00_00Z@1)*
# Multiply by 1 if neither is 255 (NoData), 0 otherwise
(DavisQuad2012-02-25T16_00_00Z@1 != 255 AND DavisQuad2012-02-29T16_00_00Z@1 != 255))
# Subtract 32768 if either one was NoData, giving us -32768 for NoData.
-
(32768*(DavisQuad2012-02-25T16_00_00Z@1 = 255 OR DavisQuad2012-02-29T16_00_00Z@1 = 255))
Of course, you can’t actually put the comments in. But what it does is this: First, I subtract one raster from the other and multiply that by the logical operation that neither one contains NoData. That gives me the difference of the rasters, or 0 if either one contains NoData. Then I subtract 32768 multiplied by the inverse of the aforementioned logical operation, so any pixel with a NoData value in either of the original rasters is -32768 in the new one.
Tag: Gdal
Conditionals in the QGIS raster calculator
I needed to do some conditionals in the QGIS raster calculator, but it doesn’t support that—or at least doesn’t seem to. But it does support logical operators, with a result of either 0 or 1. For instance, here’s the script I wrote:
# Subtract them
((DavisQuad2012-02-25T16_00_00Z@1  -  DavisQuad2012-02-29T16_00_00Z@1)*
# Multiply by 1 if neither is 255 (NoData), 0 otherwise
(DavisQuad2012-02-25T16_00_00Z@1 != 255 AND DavisQuad2012-02-29T16_00_00Z@1 != 255))
# Subtract 32768 if either one was NoData, giving us -32768 for NoData.
-
(32768*(DavisQuad2012-02-25T16_00_00Z@1 = 255 OR DavisQuad2012-02-29T16_00_00Z@1 = 255))
Of course, you can’t actually put the comments in. But what it does is this: First, I subtract one raster from the other and multiply that by the logical operation that neither one contains NoData. That gives me the difference of the rasters, or 0 if either one contains NoData. Then I subtract 32768 multiplied by the inverse of the aforementioned logical operation, so any pixel with a NoData value in either of the original rasters is -32768 in the new one.
More Basemaps in QGIS
One of the more popular posts on this blog has been my piece on adding basemaps to QGIS. While the OpenLayer plugin is great, one of the things that I find dissatisfying is that it requires reprojecting your data to match the EPSG:3857 basemap. I often work in State Plane, and I’d just as soon have my data stay in that projection, which will also minimize local distortion. Well, as it turns out, one can add tiled map services as GDAL raster layers, with all the benefits that entails (e.g. reprojection). What you need to do is create an XML file like the following (which is lifted almost verbatim from the GDAL website, specifically this file):
Tag: Qgis
Conditionals in the QGIS raster calculator
I needed to do some conditionals in the QGIS raster calculator, but it doesn’t support that—or at least doesn’t seem to. But it does support logical operators, with a result of either 0 or 1. For instance, here’s the script I wrote:
# Subtract them
((DavisQuad2012-02-25T16_00_00Z@1  -  DavisQuad2012-02-29T16_00_00Z@1)*
# Multiply by 1 if neither is 255 (NoData), 0 otherwise
(DavisQuad2012-02-25T16_00_00Z@1 != 255 AND DavisQuad2012-02-29T16_00_00Z@1 != 255))
# Subtract 32768 if either one was NoData, giving us -32768 for NoData.
-
(32768*(DavisQuad2012-02-25T16_00_00Z@1 = 255 OR DavisQuad2012-02-29T16_00_00Z@1 = 255))
Of course, you can’t actually put the comments in. But what it does is this: First, I subtract one raster from the other and multiply that by the logical operation that neither one contains NoData. That gives me the difference of the rasters, or 0 if either one contains NoData. Then I subtract 32768 multiplied by the inverse of the aforementioned logical operation, so any pixel with a NoData value in either of the original rasters is -32768 in the new one.
Conditional Labels in QGIS
I fairly commonly find myself in a situation where I would like to display one label for certain features and another for other features in the same layer. QGIS doesn’t have an official way to split labels up into categories, and until now I’d resorted to having two layers to render otherwise identical features. But, in the new, excellent expression based labeling from Nathan Woodrow, I realized one can use an SQL CASE statement. For instance, one time I need to use two types labels is when labeling roads in OpenStreetMap: I want to use the name tag, unless the feature has a ref tag defined (a name tag might be ‘Capital City Freeway’, while the ref tag would be ‘US 50’). Here’s how I solved that particular problem:
More Basemaps in QGIS
One of the more popular posts on this blog has been my piece on adding basemaps to QGIS. While the OpenLayer plugin is great, one of the things that I find dissatisfying is that it requires reprojecting your data to match the EPSG:3857 basemap. I often work in State Plane, and I’d just as soon have my data stay in that projection, which will also minimize local distortion. Well, as it turns out, one can add tiled map services as GDAL raster layers, with all the benefits that entails (e.g. reprojection). What you need to do is create an XML file like the following (which is lifted almost verbatim from the GDAL website, specifically this file):
Transit to Everywhere
![]() Data courtesy MapQuest and OpenStreetMap CC-BY-SA, the City and County of San Francisco, and Bay Area Rapid Transit
Data courtesy MapQuest and OpenStreetMap CC-BY-SA, the City and County of San Francisco, and Bay Area Rapid Transit
This is an overlay of the transit and walking trip plans generated by OpenTripPlanner from Powell and Market to every other intersection in San Francisco, after Eric Fischer’s map of walking routes to every intersection in San Francisco. It brings out the transit routes but also shows well-used walking routes. The lines do not vary in width (don’t let Market Street fool you, it’s actually several lines—BART, MUNI rail in 2 directions, Muni bus, walking—very near each other). The lines fade where there are fewer routes using them, because they are rendered as black set at 10% opacity. Where there are more lines overlapping, the lines become darker, in what I believe is a log (or log-like) scale. It ended up just mostly being a map of San Francisco, with transit routes emphasized. It doesn’t show potential utilization of the transit system, because the routes are not weighted (it would probably be wise to weight the routes by the density of the block they terminate in and by their service area; i.e., estimate the number of people within the Thiessen polygon of each intersection and weight the route by that). Also, I had difficulty finding an opacity level where the usage of transit routes fades towards the end (as it clearly should) but still shows the streets that walked down by just one or two trip plans.
Accessing GTFS Data in QGIS
When you load GTFS data into PostGIS using gtfsdb, you can’t access that data in QGIS because the tables don’t have a primary key in int4 format (the primary key is in text format).
If your transit system uses numeric ids in text format, an easy fix is running this against each of your tables:
ALTER TABLE stops ADD COLUMN gid int;
UPDATE stops SET gid = stop_id::int;
ALTER TABLE stops ALTER COLUMN gid SET NOT NULL;
ALTER TABLE stops ADD CONSTRAINT stops_gid_uniq UNIQUE(gid);
What this does is creates an integer ID field, populates it with the stop_id (or shape_id, &c.) cast to an integer, then adds NOT NULL and UNIQUE constraints to the column. You can’t add the constraints beforehand, because the column is initialized to NULL values. Remember you have to run these commands against every table you want to pull into QGIS directly, and remember to change stop_id to shape_id &c.
Installing QGIS-1.7 on Fedora
The QGIS instructions for building from source are targeted at Ubuntu, but they translate fairly well to Fedora. Here’s a quick guide:
Instead of preparing apt as they say, use yum or Package Manager to install these packages:
- cmake
- bison
- flex
- grass-devel
- geos-devel
- PyQt4-devel
- gsl-devel
- qwt-devel
- gdal-devel
There may be few that I already had installed on my system and missed; if you run configure below and find missing dependencies, run yum search <whatever> in a terminal to look for it. Make sure you install any relevant -devel packages as well.
Blog to Watch: Under Dark
If you’re interested in Open Source GIS and especially QGIS, I highly suggest you give the blog “Under Dark” a read - the author seems to be very clued in the latest developments, and the blog is very active.
Basemaps in QGIS
**Update 2012-02-02 17:57 -0800:I just wrote a post about another way to do this.
I really like QGIS. It’s a powerful GIS that runs on Linux (among other operating systems) and doesn’t require incredible amounts of CPU. One criticism I had of it was that it did not provide the same ‘click-and-go’ basemap experience one can get with ArcGIS for making simple maps (i.e. Add Basemap, select Bing, DeLorme, &c. and you’re done). No more! Thanks to the qgis-openlayers plugin available on GitHub, you can now use OSM, Google Maps, Yahoo Maps and Bing Maps as base layers in your project (side note: make sure you don’t violate any copyrights by using them). I’ve had a little trouble with the projections, but I’m not that good with dynamic reprojection in QGIS yet, so I’m sure it’s my error.; Unfortunately, the layers don’t support reprojection, so your project is basically forced to use Google Mercator—which may be a showstopper but is often acceptable for quick maps (remember, QGIS can reproject your other layers). If you do want reprojection, see this post.
Tag: Raster
Conditionals in the QGIS raster calculator
I needed to do some conditionals in the QGIS raster calculator, but it doesn’t support that—or at least doesn’t seem to. But it does support logical operators, with a result of either 0 or 1. For instance, here’s the script I wrote:
# Subtract them
((DavisQuad2012-02-25T16_00_00Z@1  -  DavisQuad2012-02-29T16_00_00Z@1)*
# Multiply by 1 if neither is 255 (NoData), 0 otherwise
(DavisQuad2012-02-25T16_00_00Z@1 != 255 AND DavisQuad2012-02-29T16_00_00Z@1 != 255))
# Subtract 32768 if either one was NoData, giving us -32768 for NoData.
-
(32768*(DavisQuad2012-02-25T16_00_00Z@1 = 255 OR DavisQuad2012-02-29T16_00_00Z@1 = 255))
Of course, you can’t actually put the comments in. But what it does is this: First, I subtract one raster from the other and multiply that by the logical operation that neither one contains NoData. That gives me the difference of the rasters, or 0 if either one contains NoData. Then I subtract 32768 multiplied by the inverse of the aforementioned logical operation, so any pixel with a NoData value in either of the original rasters is -32768 in the new one.
Tag: Case
Conditional Labels in QGIS
I fairly commonly find myself in a situation where I would like to display one label for certain features and another for other features in the same layer. QGIS doesn’t have an official way to split labels up into categories, and until now I’d resorted to having two layers to render otherwise identical features. But, in the new, excellent expression based labeling from Nathan Woodrow, I realized one can use an SQL CASE statement. For instance, one time I need to use two types labels is when labeling roads in OpenStreetMap: I want to use the name tag, unless the feature has a ref tag defined (a name tag might be ‘Capital City Freeway’, while the ref tag would be ‘US 50’). Here’s how I solved that particular problem:
Tag: Conditionallabels
Conditional Labels in QGIS
I fairly commonly find myself in a situation where I would like to display one label for certain features and another for other features in the same layer. QGIS doesn’t have an official way to split labels up into categories, and until now I’d resorted to having two layers to render otherwise identical features. But, in the new, excellent expression based labeling from Nathan Woodrow, I realized one can use an SQL CASE statement. For instance, one time I need to use two types labels is when labeling roads in OpenStreetMap: I want to use the name tag, unless the feature has a ref tag defined (a name tag might be ‘Capital City Freeway’, while the ref tag would be ‘US 50’). Here’s how I solved that particular problem:
Tag: Expressionbasedlabels
Conditional Labels in QGIS
I fairly commonly find myself in a situation where I would like to display one label for certain features and another for other features in the same layer. QGIS doesn’t have an official way to split labels up into categories, and until now I’d resorted to having two layers to render otherwise identical features. But, in the new, excellent expression based labeling from Nathan Woodrow, I realized one can use an SQL CASE statement. For instance, one time I need to use two types labels is when labeling roads in OpenStreetMap: I want to use the name tag, unless the feature has a ref tag defined (a name tag might be ‘Capital City Freeway’, while the ref tag would be ‘US 50’). Here’s how I solved that particular problem:
Tag: Labels
Conditional Labels in QGIS
I fairly commonly find myself in a situation where I would like to display one label for certain features and another for other features in the same layer. QGIS doesn’t have an official way to split labels up into categories, and until now I’d resorted to having two layers to render otherwise identical features. But, in the new, excellent expression based labeling from Nathan Woodrow, I realized one can use an SQL CASE statement. For instance, one time I need to use two types labels is when labeling roads in OpenStreetMap: I want to use the name tag, unless the feature has a ref tag defined (a name tag might be ‘Capital City Freeway’, while the ref tag would be ‘US 50’). Here’s how I solved that particular problem:
Tag: Openstreetmap
Conditional Labels in QGIS
I fairly commonly find myself in a situation where I would like to display one label for certain features and another for other features in the same layer. QGIS doesn’t have an official way to split labels up into categories, and until now I’d resorted to having two layers to render otherwise identical features. But, in the new, excellent expression based labeling from Nathan Woodrow, I realized one can use an SQL CASE statement. For instance, one time I need to use two types labels is when labeling roads in OpenStreetMap: I want to use the name tag, unless the feature has a ref tag defined (a name tag might be ‘Capital City Freeway’, while the ref tag would be ‘US 50’). Here’s how I solved that particular problem:
Basemaps in QGIS
**Update 2012-02-02 17:57 -0800:I just wrote a post about another way to do this.
I really like QGIS. It’s a powerful GIS that runs on Linux (among other operating systems) and doesn’t require incredible amounts of CPU. One criticism I had of it was that it did not provide the same ‘click-and-go’ basemap experience one can get with ArcGIS for making simple maps (i.e. Add Basemap, select Bing, DeLorme, &c. and you’re done). No more! Thanks to the qgis-openlayers plugin available on GitHub, you can now use OSM, Google Maps, Yahoo Maps and Bing Maps as base layers in your project (side note: make sure you don’t violate any copyrights by using them). I’ve had a little trouble with the projections, but I’m not that good with dynamic reprojection in QGIS yet, so I’m sure it’s my error.; Unfortunately, the layers don’t support reprojection, so your project is basically forced to use Google Mercator—which may be a showstopper but is often acceptable for quick maps (remember, QGIS can reproject your other layers). If you do want reprojection, see this post.
Tag: Osm
Conditional Labels in QGIS
I fairly commonly find myself in a situation where I would like to display one label for certain features and another for other features in the same layer. QGIS doesn’t have an official way to split labels up into categories, and until now I’d resorted to having two layers to render otherwise identical features. But, in the new, excellent expression based labeling from Nathan Woodrow, I realized one can use an SQL CASE statement. For instance, one time I need to use two types labels is when labeling roads in OpenStreetMap: I want to use the name tag, unless the feature has a ref tag defined (a name tag might be ‘Capital City Freeway’, while the ref tag would be ‘US 50’). Here’s how I solved that particular problem:
Transit to Everywhere
![]() Data courtesy MapQuest and OpenStreetMap CC-BY-SA, the City and County of San Francisco, and Bay Area Rapid Transit
Data courtesy MapQuest and OpenStreetMap CC-BY-SA, the City and County of San Francisco, and Bay Area Rapid Transit
This is an overlay of the transit and walking trip plans generated by OpenTripPlanner from Powell and Market to every other intersection in San Francisco, after Eric Fischer’s map of walking routes to every intersection in San Francisco. It brings out the transit routes but also shows well-used walking routes. The lines do not vary in width (don’t let Market Street fool you, it’s actually several lines—BART, MUNI rail in 2 directions, Muni bus, walking—very near each other). The lines fade where there are fewer routes using them, because they are rendered as black set at 10% opacity. Where there are more lines overlapping, the lines become darker, in what I believe is a log (or log-like) scale. It ended up just mostly being a map of San Francisco, with transit routes emphasized. It doesn’t show potential utilization of the transit system, because the routes are not weighted (it would probably be wise to weight the routes by the density of the block they terminate in and by their service area; i.e., estimate the number of people within the Thiessen polygon of each intersection and weight the route by that). Also, I had difficulty finding an opacity level where the usage of transit routes fades towards the end (as it clearly should) but still shows the streets that walked down by just one or two trip plans.
Google Maps Tile Scales
I found this buried deep in an appendix of the Mapnik XML Schema Reference, and I thought it so useful I am reposting it here:
Zoom level Scale denominator
0
559,082,264
1
279,541,132
2
139,770,566
3
69,885,283
4
34,942,642
5
17,471,321
6
8,735,660
7
4,367,830
8
2,183,915
9
1,091,958
10
545,979
11
272,989
12
136,495
13
68,247
14
34,124
15
17,062
16
8,531
17
4,265
18
2,133
19
1,066
20
533
These are used not only by Google Maps, but also by Bing Maps, OSM, CloudMade and many others, and in fact just about any Google Mercator tile source.
Tag: Sql
Conditional Labels in QGIS
I fairly commonly find myself in a situation where I would like to display one label for certain features and another for other features in the same layer. QGIS doesn’t have an official way to split labels up into categories, and until now I’d resorted to having two layers to render otherwise identical features. But, in the new, excellent expression based labeling from Nathan Woodrow, I realized one can use an SQL CASE statement. For instance, one time I need to use two types labels is when labeling roads in OpenStreetMap: I want to use the name tag, unless the feature has a ref tag defined (a name tag might be ‘Capital City Freeway’, while the ref tag would be ‘US 50’). Here’s how I solved that particular problem:
GTFSrDB: Plumbing for GTFS-realtime
Over the last week I’ve started a new project, GTFSrDB, which allows you to connect GTFS-realtime with an SQL database, allowing app developers to use realtime data through SQL, just as easily as they use static data. Rather than worry about plumbing to connect GTFS and GTFS-realtime, they can focus on writing apps.
It accomplishes two primary tasks:
Keeping a database up-to-date with the latest realtime data, and
Archiving historic real-time data.
Accessing GTFS Data in QGIS
When you load GTFS data into PostGIS using gtfsdb, you can’t access that data in QGIS because the tables don’t have a primary key in int4 format (the primary key is in text format).
If your transit system uses numeric ids in text format, an easy fix is running this against each of your tables:
ALTER TABLE stops ADD COLUMN gid int;
UPDATE stops SET gid = stop_id::int;
ALTER TABLE stops ALTER COLUMN gid SET NOT NULL;
ALTER TABLE stops ADD CONSTRAINT stops_gid_uniq UNIQUE(gid);
What this does is creates an integer ID field, populates it with the stop_id (or shape_id, &c.) cast to an integer, then adds NOT NULL and UNIQUE constraints to the column. You can’t add the constraints beforehand, because the column is initialized to NULL values. Remember you have to run these commands against every table you want to pull into QGIS directly, and remember to change stop_id to shape_id &c.
Tag: Basemaps
More Basemaps in QGIS
One of the more popular posts on this blog has been my piece on adding basemaps to QGIS. While the OpenLayer plugin is great, one of the things that I find dissatisfying is that it requires reprojecting your data to match the EPSG:3857 basemap. I often work in State Plane, and I’d just as soon have my data stay in that projection, which will also minimize local distortion. Well, as it turns out, one can add tiled map services as GDAL raster layers, with all the benefits that entails (e.g. reprojection). What you need to do is create an XML file like the following (which is lifted almost verbatim from the GDAL website, specifically this file):
Tag: Tiles
More Basemaps in QGIS
One of the more popular posts on this blog has been my piece on adding basemaps to QGIS. While the OpenLayer plugin is great, one of the things that I find dissatisfying is that it requires reprojecting your data to match the EPSG:3857 basemap. I often work in State Plane, and I’d just as soon have my data stay in that projection, which will also minimize local distortion. Well, as it turns out, one can add tiled map services as GDAL raster layers, with all the benefits that entails (e.g. reprojection). What you need to do is create an XML file like the following (which is lifted almost verbatim from the GDAL website, specifically this file):
Tag: Tms
More Basemaps in QGIS
One of the more popular posts on this blog has been my piece on adding basemaps to QGIS. While the OpenLayer plugin is great, one of the things that I find dissatisfying is that it requires reprojecting your data to match the EPSG:3857 basemap. I often work in State Plane, and I’d just as soon have my data stay in that projection, which will also minimize local distortion. Well, as it turns out, one can add tiled map services as GDAL raster layers, with all the benefits that entails (e.g. reprojection). What you need to do is create an XML file like the following (which is lifted almost verbatim from the GDAL website, specifically this file):
Tag: Bart
Transit to Everywhere
![]() Data courtesy MapQuest and OpenStreetMap CC-BY-SA, the City and County of San Francisco, and Bay Area Rapid Transit
Data courtesy MapQuest and OpenStreetMap CC-BY-SA, the City and County of San Francisco, and Bay Area Rapid Transit
This is an overlay of the transit and walking trip plans generated by OpenTripPlanner from Powell and Market to every other intersection in San Francisco, after Eric Fischer’s map of walking routes to every intersection in San Francisco. It brings out the transit routes but also shows well-used walking routes. The lines do not vary in width (don’t let Market Street fool you, it’s actually several lines—BART, MUNI rail in 2 directions, Muni bus, walking—very near each other). The lines fade where there are fewer routes using them, because they are rendered as black set at 10% opacity. Where there are more lines overlapping, the lines become darker, in what I believe is a log (or log-like) scale. It ended up just mostly being a map of San Francisco, with transit routes emphasized. It doesn’t show potential utilization of the transit system, because the routes are not weighted (it would probably be wise to weight the routes by the density of the block they terminate in and by their service area; i.e., estimate the number of people within the Thiessen polygon of each intersection and weight the route by that). Also, I had difficulty finding an opacity level where the usage of transit routes fades towards the end (as it clearly should) but still shows the streets that walked down by just one or two trip plans.
Accessing GTFS Data in QGIS
When you load GTFS data into PostGIS using gtfsdb, you can’t access that data in QGIS because the tables don’t have a primary key in int4 format (the primary key is in text format).
If your transit system uses numeric ids in text format, an easy fix is running this against each of your tables:
ALTER TABLE stops ADD COLUMN gid int;
UPDATE stops SET gid = stop_id::int;
ALTER TABLE stops ALTER COLUMN gid SET NOT NULL;
ALTER TABLE stops ADD CONSTRAINT stops_gid_uniq UNIQUE(gid);
What this does is creates an integer ID field, populates it with the stop_id (or shape_id, &c.) cast to an integer, then adds NOT NULL and UNIQUE constraints to the column. You can’t add the constraints beforehand, because the column is initialized to NULL values. Remember you have to run these commands against every table you want to pull into QGIS directly, and remember to change stop_id to shape_id &c.
Tag: Ericfischer
Transit to Everywhere
![]() Data courtesy MapQuest and OpenStreetMap CC-BY-SA, the City and County of San Francisco, and Bay Area Rapid Transit
Data courtesy MapQuest and OpenStreetMap CC-BY-SA, the City and County of San Francisco, and Bay Area Rapid Transit
This is an overlay of the transit and walking trip plans generated by OpenTripPlanner from Powell and Market to every other intersection in San Francisco, after Eric Fischer’s map of walking routes to every intersection in San Francisco. It brings out the transit routes but also shows well-used walking routes. The lines do not vary in width (don’t let Market Street fool you, it’s actually several lines—BART, MUNI rail in 2 directions, Muni bus, walking—very near each other). The lines fade where there are fewer routes using them, because they are rendered as black set at 10% opacity. Where there are more lines overlapping, the lines become darker, in what I believe is a log (or log-like) scale. It ended up just mostly being a map of San Francisco, with transit routes emphasized. It doesn’t show potential utilization of the transit system, because the routes are not weighted (it would probably be wise to weight the routes by the density of the block they terminate in and by their service area; i.e., estimate the number of people within the Thiessen polygon of each intersection and weight the route by that). Also, I had difficulty finding an opacity level where the usage of transit routes fades towards the end (as it clearly should) but still shows the streets that walked down by just one or two trip plans.
Another LA Metro Visualization
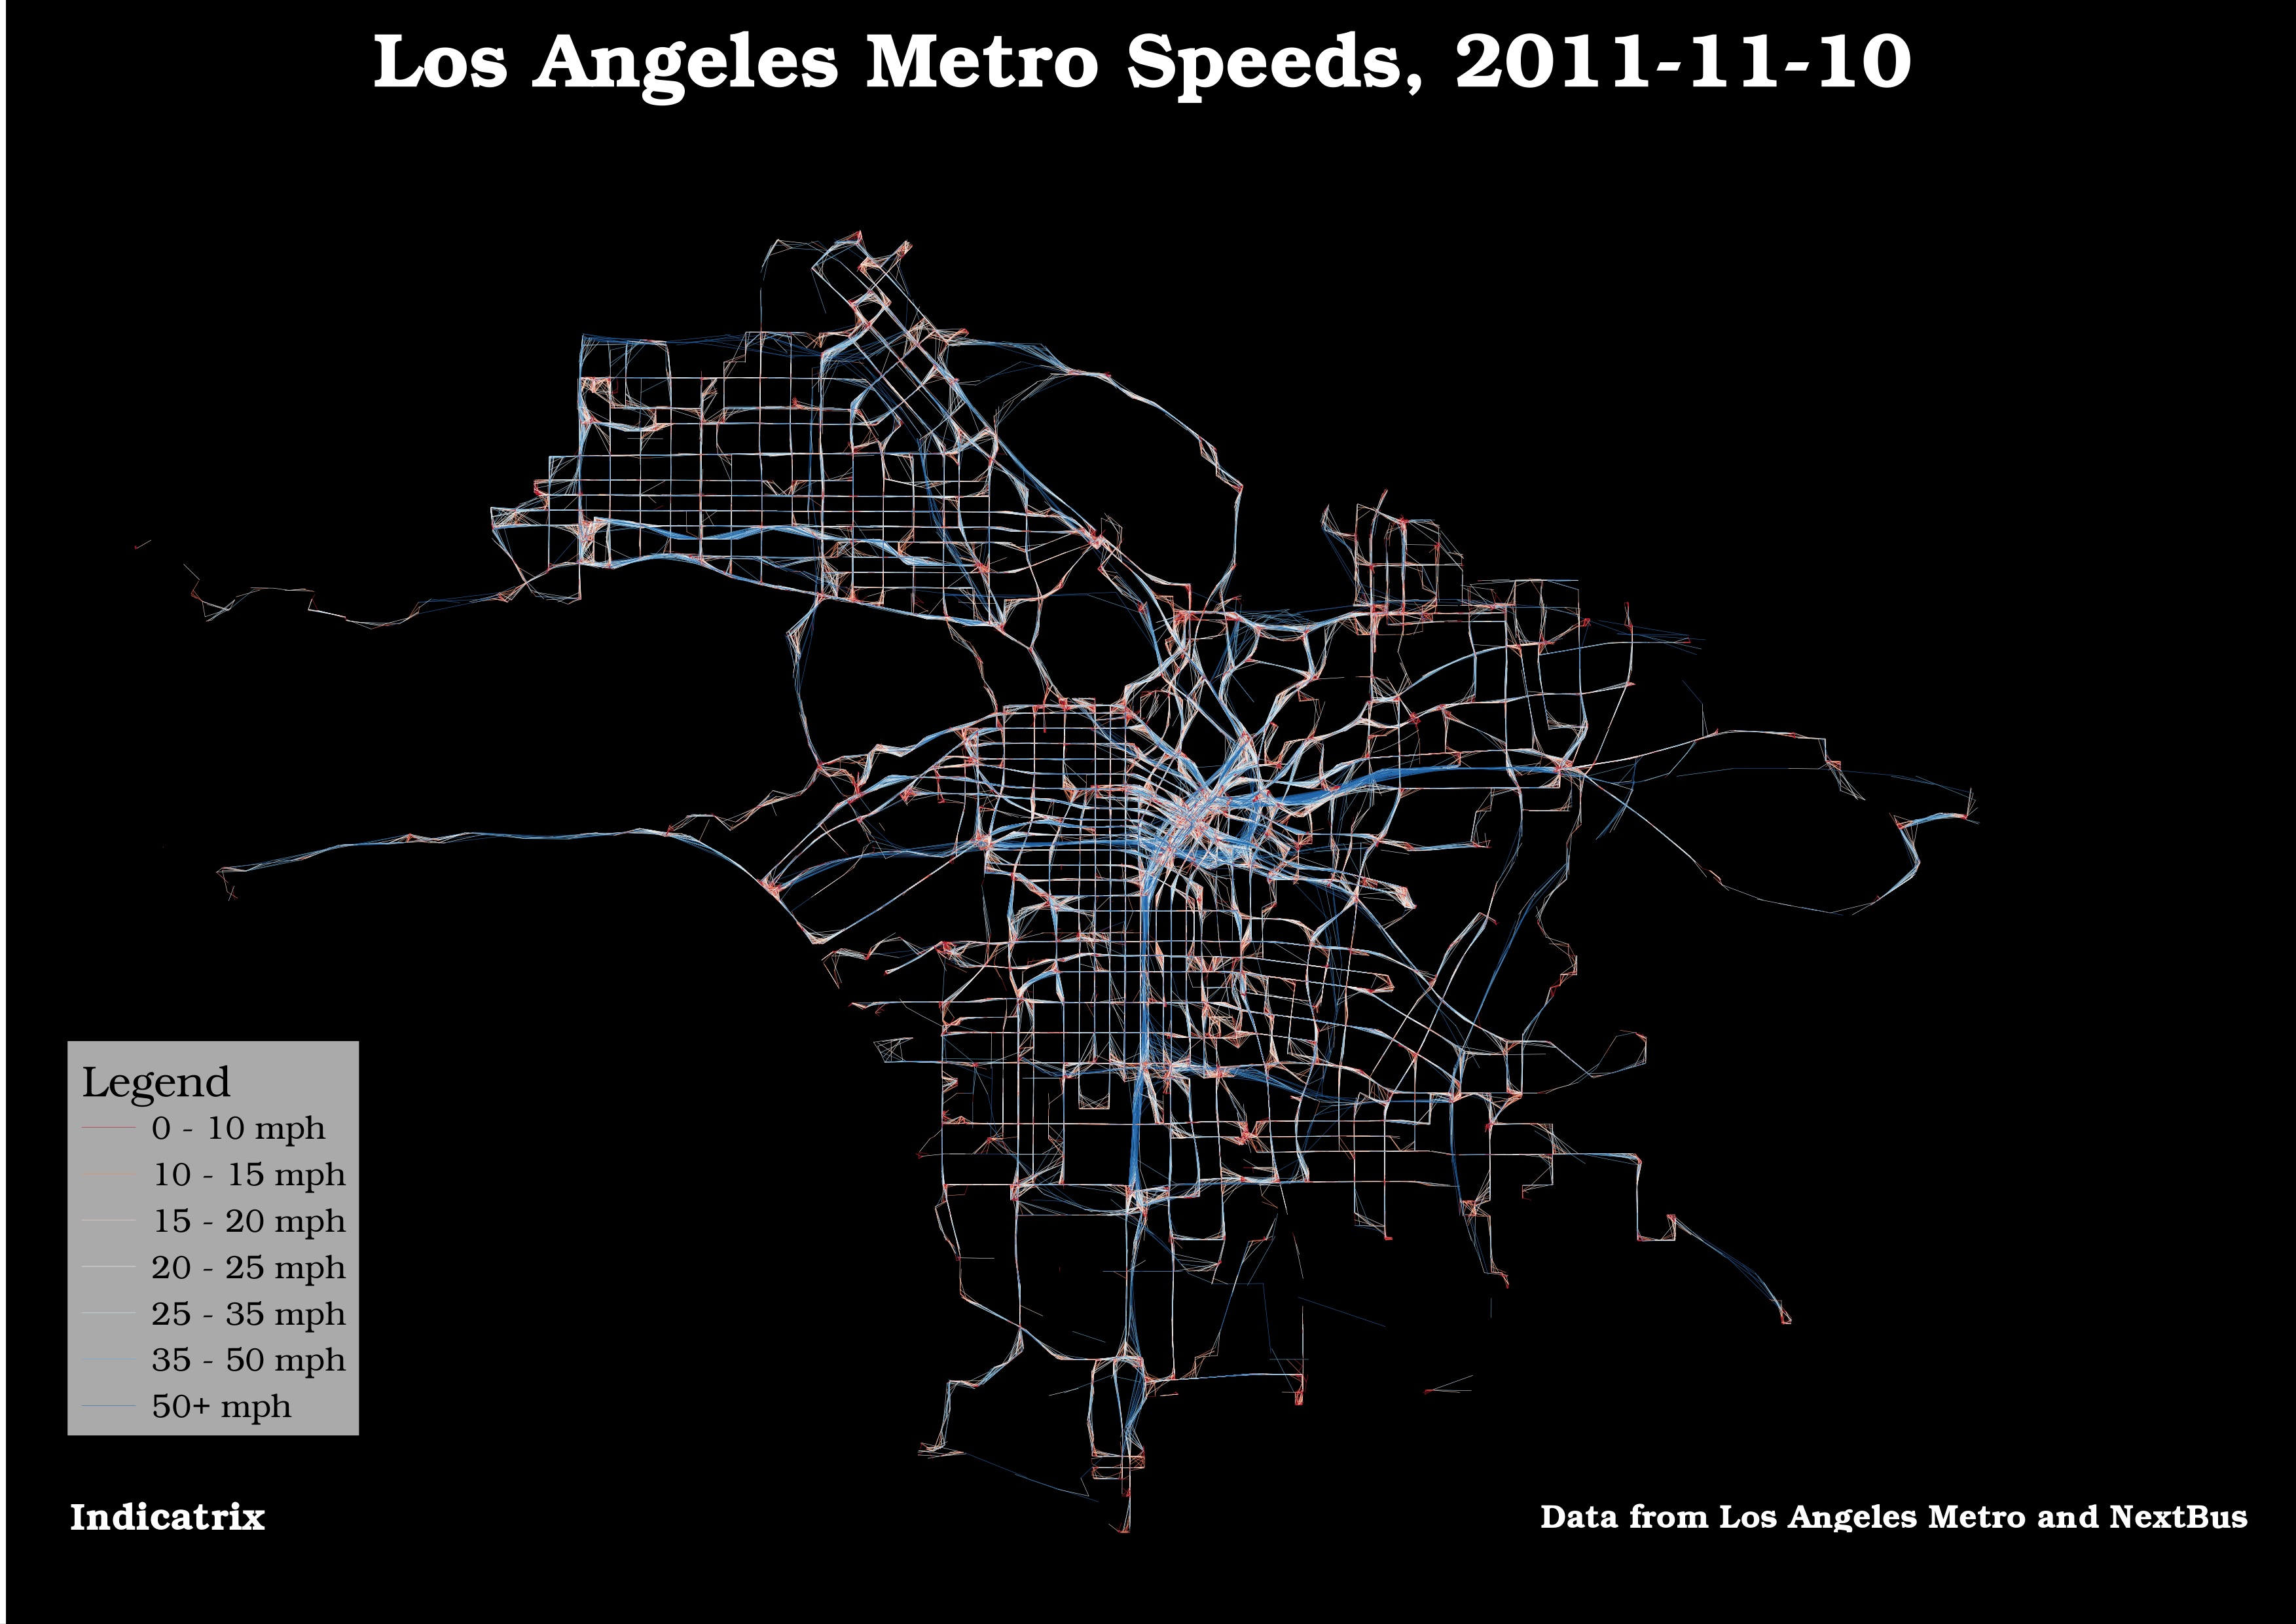
Here’s another visualization of the data used in the previous post; I made the lines a lot finer, so the noise is less visible. It’s easier than ever to see the Silver Line. I classed the data manually this time.
Making Transit Travel Speed Maps with Open Source GIS
Update 2011-11-12 8:21 -0800: I just posted a visualization I like better.
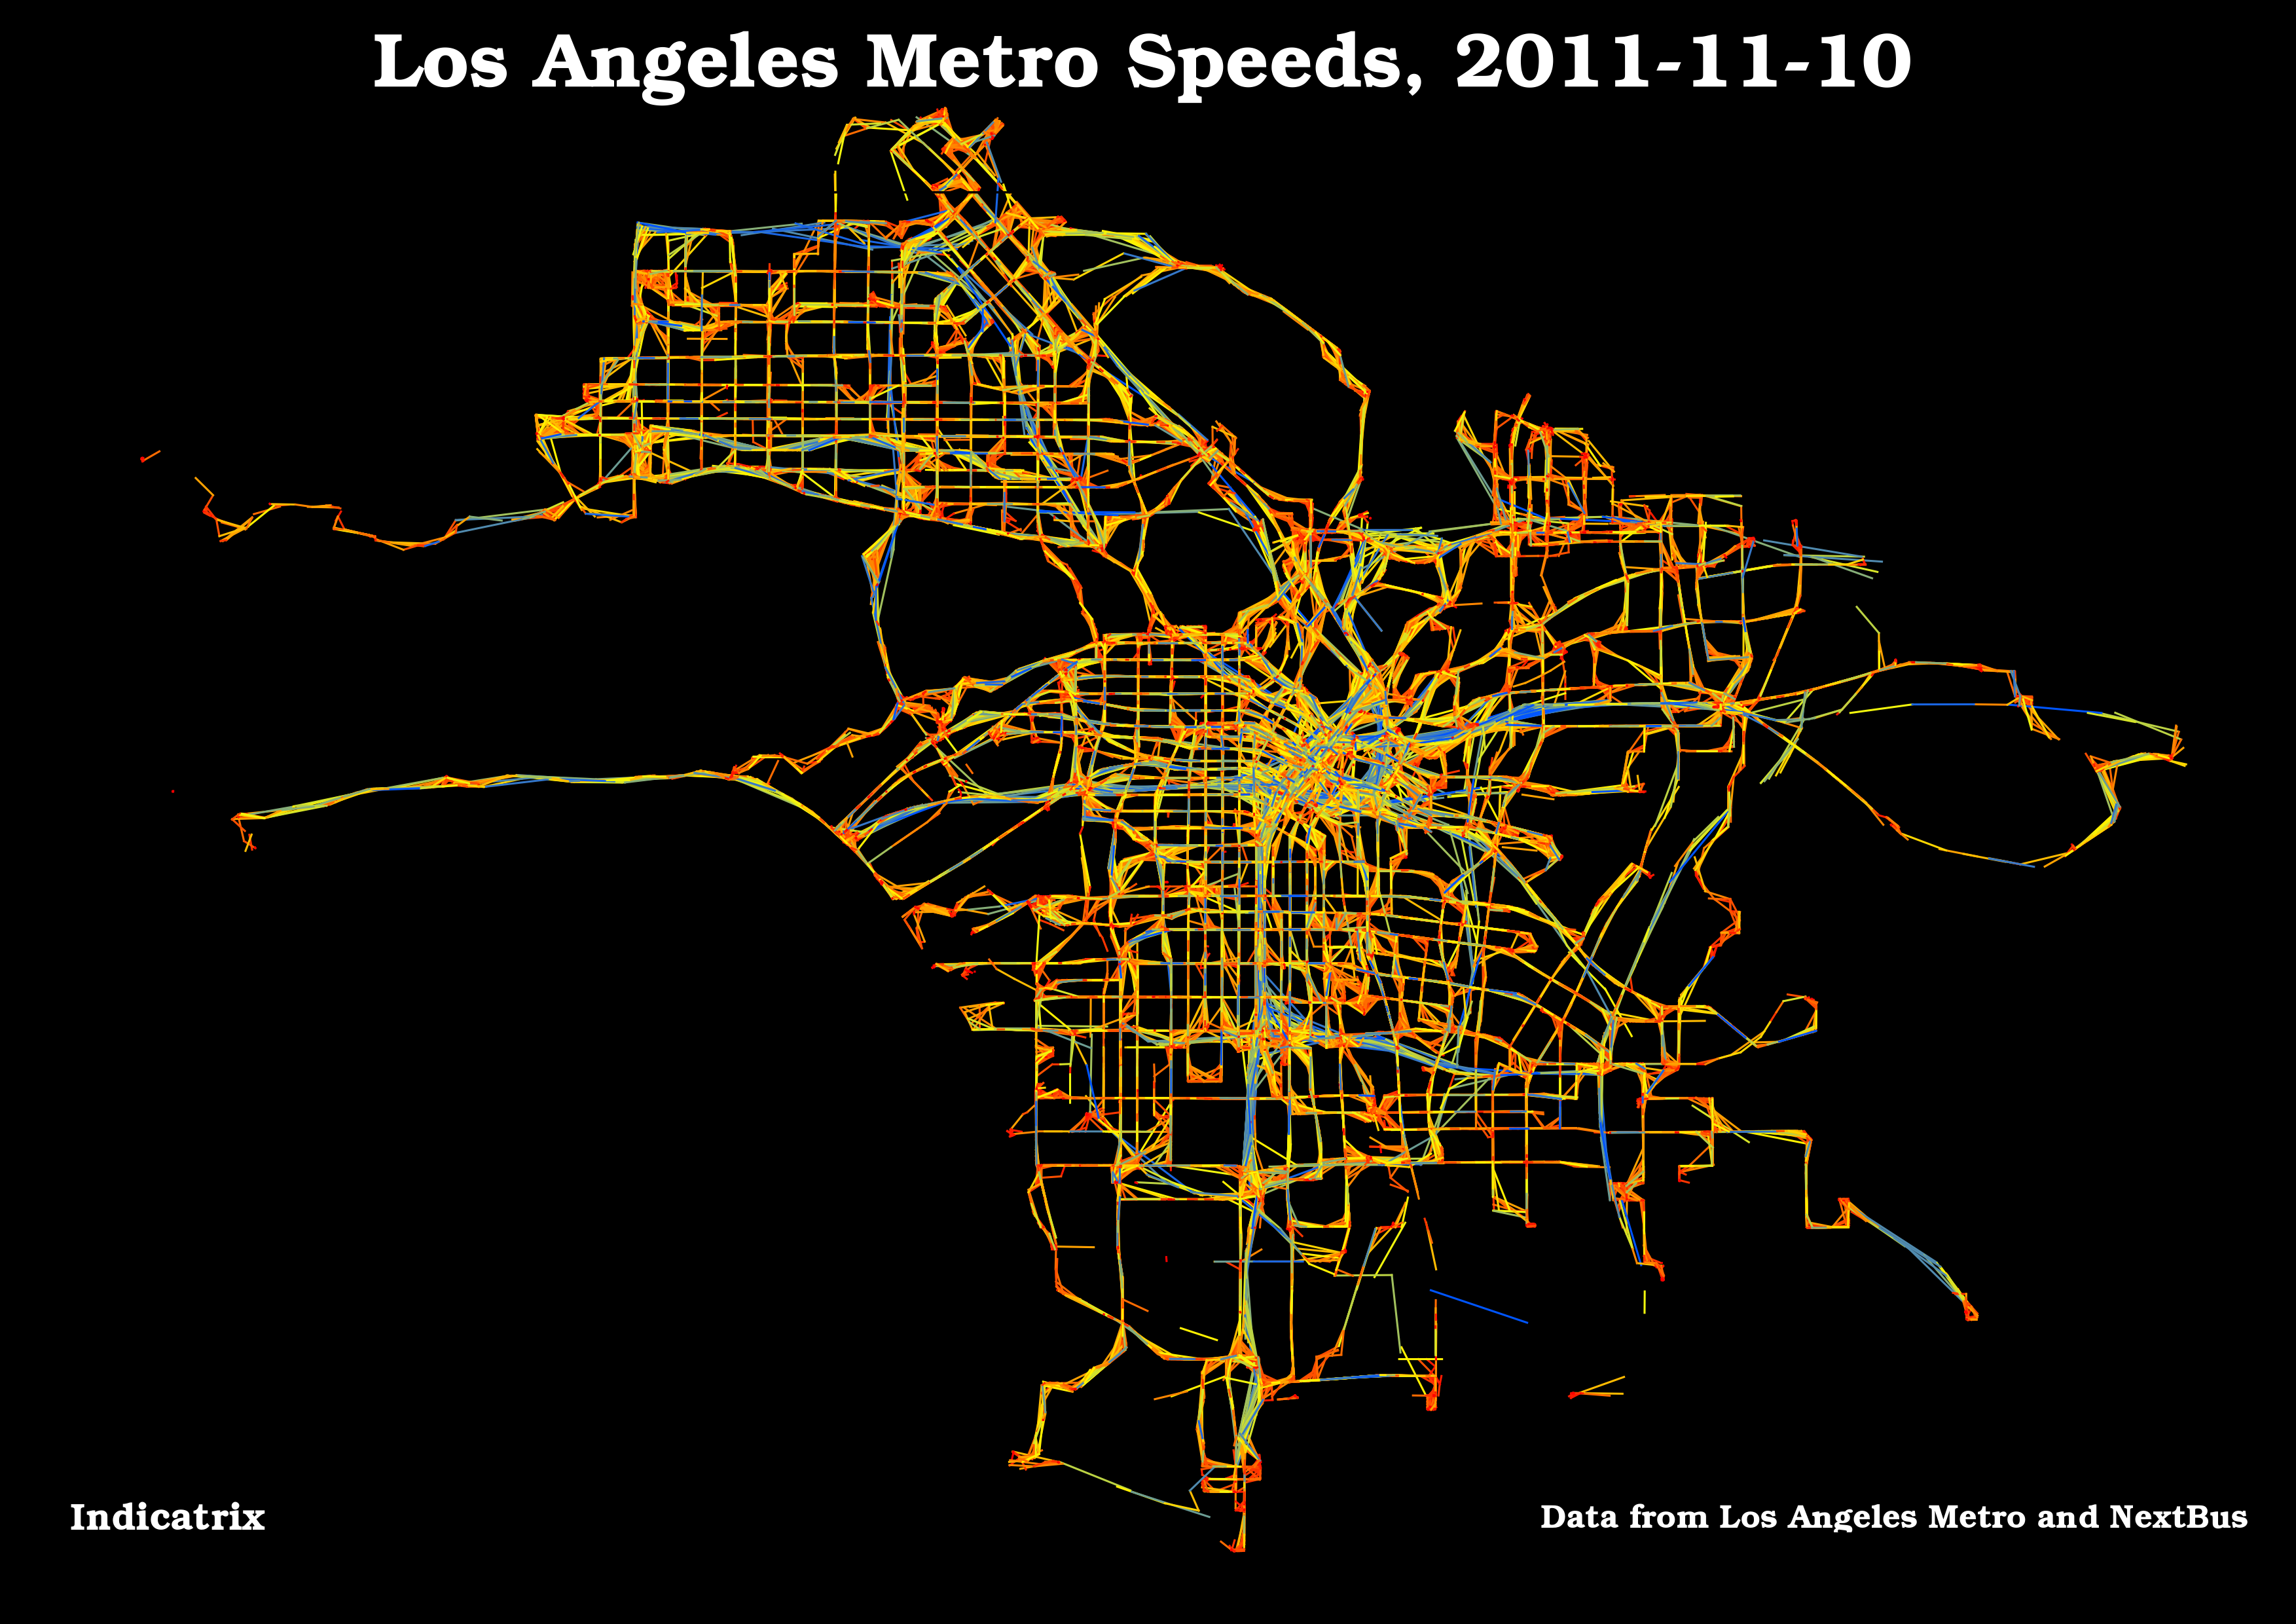
The Internet has been abuzz the past week regarding transit speed maps. It seems to have been spurred by a post on Bostongraphy, which was inspired by many of the amazing visualizations produced by Eric Fischer, especially this one. Indeed, this blog has gotten a fair bit of traffic itself, because Andy Woodruff of Bostonography used my avl2postgis project to retrieve the data.
Tag: Opentripplanner
Transit to Everywhere
![]() Data courtesy MapQuest and OpenStreetMap CC-BY-SA, the City and County of San Francisco, and Bay Area Rapid Transit
Data courtesy MapQuest and OpenStreetMap CC-BY-SA, the City and County of San Francisco, and Bay Area Rapid Transit
This is an overlay of the transit and walking trip plans generated by OpenTripPlanner from Powell and Market to every other intersection in San Francisco, after Eric Fischer’s map of walking routes to every intersection in San Francisco. It brings out the transit routes but also shows well-used walking routes. The lines do not vary in width (don’t let Market Street fool you, it’s actually several lines—BART, MUNI rail in 2 directions, Muni bus, walking—very near each other). The lines fade where there are fewer routes using them, because they are rendered as black set at 10% opacity. Where there are more lines overlapping, the lines become darker, in what I believe is a log (or log-like) scale. It ended up just mostly being a map of San Francisco, with transit routes emphasized. It doesn’t show potential utilization of the transit system, because the routes are not weighted (it would probably be wise to weight the routes by the density of the block they terminate in and by their service area; i.e., estimate the number of people within the Thiessen polygon of each intersection and weight the route by that). Also, I had difficulty finding an opacity level where the usage of transit routes fades towards the end (as it clearly should) but still shows the streets that walked down by just one or two trip plans.
Tag: Otp
Transit to Everywhere
![]() Data courtesy MapQuest and OpenStreetMap CC-BY-SA, the City and County of San Francisco, and Bay Area Rapid Transit
Data courtesy MapQuest and OpenStreetMap CC-BY-SA, the City and County of San Francisco, and Bay Area Rapid Transit
This is an overlay of the transit and walking trip plans generated by OpenTripPlanner from Powell and Market to every other intersection in San Francisco, after Eric Fischer’s map of walking routes to every intersection in San Francisco. It brings out the transit routes but also shows well-used walking routes. The lines do not vary in width (don’t let Market Street fool you, it’s actually several lines—BART, MUNI rail in 2 directions, Muni bus, walking—very near each other). The lines fade where there are fewer routes using them, because they are rendered as black set at 10% opacity. Where there are more lines overlapping, the lines become darker, in what I believe is a log (or log-like) scale. It ended up just mostly being a map of San Francisco, with transit routes emphasized. It doesn’t show potential utilization of the transit system, because the routes are not weighted (it would probably be wise to weight the routes by the density of the block they terminate in and by their service area; i.e., estimate the number of people within the Thiessen polygon of each intersection and weight the route by that). Also, I had difficulty finding an opacity level where the usage of transit routes fades towards the end (as it clearly should) but still shows the streets that walked down by just one or two trip plans.
Tag: Postgis
Transit to Everywhere
![]() Data courtesy MapQuest and OpenStreetMap CC-BY-SA, the City and County of San Francisco, and Bay Area Rapid Transit
Data courtesy MapQuest and OpenStreetMap CC-BY-SA, the City and County of San Francisco, and Bay Area Rapid Transit
This is an overlay of the transit and walking trip plans generated by OpenTripPlanner from Powell and Market to every other intersection in San Francisco, after Eric Fischer’s map of walking routes to every intersection in San Francisco. It brings out the transit routes but also shows well-used walking routes. The lines do not vary in width (don’t let Market Street fool you, it’s actually several lines—BART, MUNI rail in 2 directions, Muni bus, walking—very near each other). The lines fade where there are fewer routes using them, because they are rendered as black set at 10% opacity. Where there are more lines overlapping, the lines become darker, in what I believe is a log (or log-like) scale. It ended up just mostly being a map of San Francisco, with transit routes emphasized. It doesn’t show potential utilization of the transit system, because the routes are not weighted (it would probably be wise to weight the routes by the density of the block they terminate in and by their service area; i.e., estimate the number of people within the Thiessen polygon of each intersection and weight the route by that). Also, I had difficulty finding an opacity level where the usage of transit routes fades towards the end (as it clearly should) but still shows the streets that walked down by just one or two trip plans.
Another LA Metro Visualization
Here’s another visualization of the data used in the previous post; I made the lines a lot finer, so the noise is less visible. It’s easier than ever to see the Silver Line. I classed the data manually this time.
Making Transit Travel Speed Maps with Open Source GIS
Update 2011-11-12 8:21 -0800: I just posted a visualization I like better.
The Internet has been abuzz the past week regarding transit speed maps. It seems to have been spurred by a post on Bostongraphy, which was inspired by many of the amazing visualizations produced by Eric Fischer, especially this one. Indeed, this blog has gotten a fair bit of traffic itself, because Andy Woodruff of Bostonography used my avl2postgis project to retrieve the data.
Accessing GTFS Data in QGIS
When you load GTFS data into PostGIS using gtfsdb, you can’t access that data in QGIS because the tables don’t have a primary key in int4 format (the primary key is in text format).
If your transit system uses numeric ids in text format, an easy fix is running this against each of your tables:
ALTER TABLE stops ADD COLUMN gid int;
UPDATE stops SET gid = stop_id::int;
ALTER TABLE stops ALTER COLUMN gid SET NOT NULL;
ALTER TABLE stops ADD CONSTRAINT stops_gid_uniq UNIQUE(gid);
What this does is creates an integer ID field, populates it with the stop_id (or shape_id, &c.) cast to an integer, then adds NOT NULL and UNIQUE constraints to the column. You can’t add the constraints beforehand, because the column is initialized to NULL values. Remember you have to run these commands against every table you want to pull into QGIS directly, and remember to change stop_id to shape_id &c.
Archiving Historical Data from NextBus
It seems that everyone who analyzes historical NextBus data has a different way of archiving their data. There are lots of ways one can use GIS to analyze this data, from creating movies showing the pulse of the transit system, to analyzing on-time performance, to finding bottlenecks. In that vein, I’ve created a short Python script that fetches NextBus data and puts it into a PostGIS database for analysis. You can download the latest version here. Here’s a rundown on options:
Tag: Sfmuni
Transit to Everywhere
![]() Data courtesy MapQuest and OpenStreetMap CC-BY-SA, the City and County of San Francisco, and Bay Area Rapid Transit
Data courtesy MapQuest and OpenStreetMap CC-BY-SA, the City and County of San Francisco, and Bay Area Rapid Transit
This is an overlay of the transit and walking trip plans generated by OpenTripPlanner from Powell and Market to every other intersection in San Francisco, after Eric Fischer’s map of walking routes to every intersection in San Francisco. It brings out the transit routes but also shows well-used walking routes. The lines do not vary in width (don’t let Market Street fool you, it’s actually several lines—BART, MUNI rail in 2 directions, Muni bus, walking—very near each other). The lines fade where there are fewer routes using them, because they are rendered as black set at 10% opacity. Where there are more lines overlapping, the lines become darker, in what I believe is a log (or log-like) scale. It ended up just mostly being a map of San Francisco, with transit routes emphasized. It doesn’t show potential utilization of the transit system, because the routes are not weighted (it would probably be wise to weight the routes by the density of the block they terminate in and by their service area; i.e., estimate the number of people within the Thiessen polygon of each intersection and weight the route by that). Also, I had difficulty finding an opacity level where the usage of transit routes fades towards the end (as it clearly should) but still shows the streets that walked down by just one or two trip plans.
Tag: Git
GitHub Image Diffs
As you may have gathered, I like Git and GitHub. Today, I ran across a GitHub feature that is really cool and above and beyond the call of duty: not only do they produce and display diffs on text files, but also on image files! You can see an example in one of my repositories. Added points if you can figure out where the map tile is from!
Tag: Github
GitHub Image Diffs
As you may have gathered, I like Git and GitHub. Today, I ran across a GitHub feature that is really cool and above and beyond the call of duty: not only do they produce and display diffs on text files, but also on image files! You can see an example in one of my repositories. Added points if you can figure out where the map tile is from!
Tag: Images
GitHub Image Diffs
As you may have gathered, I like Git and GitHub. Today, I ran across a GitHub feature that is really cool and above and beyond the call of duty: not only do they produce and display diffs on text files, but also on image files! You can see an example in one of my repositories. Added points if you can figure out where the map tile is from!
Tag: Binary
Shapefiles in OpenLayers
Update 2011-12-14: It seems that a lot of people are coming here from web searches with phrases like “shapefile openlayers.” If all you want to do is display your data in OpenLayers, I’d highly recommend using a program like Quantum GIS to convert your Shapefile to a more web-friendly format like KML or GeoJSON. Both of these formats can be read by OpenLayers directly, and you’ll see faster performance and more browser compatibility than if you were to load your Shapefiles directly.
Tag: Javascript
Shapefiles in OpenLayers
Update 2011-12-14: It seems that a lot of people are coming here from web searches with phrases like “shapefile openlayers.” If all you want to do is display your data in OpenLayers, I’d highly recommend using a program like Quantum GIS to convert your Shapefile to a more web-friendly format like KML or GeoJSON. Both of these formats can be read by OpenLayers directly, and you’ll see faster performance and more browser compatibility than if you were to load your Shapefiles directly.
Fixed-position dialogs in jQuery UI
I’m working on a project where there is a long, scrolling page and I wanted to have a dialog that is draggable and resizeable that does not scroll away when the user scrolls down. As far as I could tell, there is no option to do this with jQuery UI’s dialog widget. But there is a quick workaround:
dialogDiv.dialog().parent().css('position', 'fixed');I use the parent because the dialog widget wraps the content in another <div> that contains the content and the other elements of the dialog box (title bar, &c.).
Tag: Js
Shapefiles in OpenLayers
Update 2011-12-14: It seems that a lot of people are coming here from web searches with phrases like “shapefile openlayers.” If all you want to do is display your data in OpenLayers, I’d highly recommend using a program like Quantum GIS to convert your Shapefile to a more web-friendly format like KML or GeoJSON. Both of these formats can be read by OpenLayers directly, and you’ll see faster performance and more browser compatibility than if you were to load your Shapefiles directly.
Tag: Openlayers
Shapefiles in OpenLayers
Update 2011-12-14: It seems that a lot of people are coming here from web searches with phrases like “shapefile openlayers.” If all you want to do is display your data in OpenLayers, I’d highly recommend using a program like Quantum GIS to convert your Shapefile to a more web-friendly format like KML or GeoJSON. Both of these formats can be read by OpenLayers directly, and you’ll see faster performance and more browser compatibility than if you were to load your Shapefiles directly.
Tag: Shapefile
Shapefiles in OpenLayers
Update 2011-12-14: It seems that a lot of people are coming here from web searches with phrases like “shapefile openlayers.” If all you want to do is display your data in OpenLayers, I’d highly recommend using a program like Quantum GIS to convert your Shapefile to a more web-friendly format like KML or GeoJSON. Both of these formats can be read by OpenLayers directly, and you’ll see faster performance and more browser compatibility than if you were to load your Shapefiles directly.
Tag: Webmapping
Shapefiles in OpenLayers
Update 2011-12-14: It seems that a lot of people are coming here from web searches with phrases like “shapefile openlayers.” If all you want to do is display your data in OpenLayers, I’d highly recommend using a program like Quantum GIS to convert your Shapefile to a more web-friendly format like KML or GeoJSON. Both of these formats can be read by OpenLayers directly, and you’ll see faster performance and more browser compatibility than if you were to load your Shapefiles directly.
Basemaps in QGIS
**Update 2012-02-02 17:57 -0800:I just wrote a post about another way to do this.
I really like QGIS. It’s a powerful GIS that runs on Linux (among other operating systems) and doesn’t require incredible amounts of CPU. One criticism I had of it was that it did not provide the same ‘click-and-go’ basemap experience one can get with ArcGIS for making simple maps (i.e. Add Basemap, select Bing, DeLorme, &c. and you’re done). No more! Thanks to the qgis-openlayers plugin available on GitHub, you can now use OSM, Google Maps, Yahoo Maps and Bing Maps as base layers in your project (side note: make sure you don’t violate any copyrights by using them). I’ve had a little trouble with the projections, but I’m not that good with dynamic reprojection in QGIS yet, so I’m sure it’s my error.; Unfortunately, the layers don’t support reprojection, so your project is basically forced to use Google Mercator—which may be a showstopper but is often acceptable for quick maps (remember, QGIS can reproject your other layers). If you do want reprojection, see this post.
Tag: Bus
Another LA Metro Visualization
Here’s another visualization of the data used in the previous post; I made the lines a lot finer, so the noise is less visible. It’s easier than ever to see the Silver Line. I classed the data manually this time.
Making Transit Travel Speed Maps with Open Source GIS
Update 2011-11-12 8:21 -0800: I just posted a visualization I like better.
The Internet has been abuzz the past week regarding transit speed maps. It seems to have been spurred by a post on Bostongraphy, which was inspired by many of the amazing visualizations produced by Eric Fischer, especially this one. Indeed, this blog has gotten a fair bit of traffic itself, because Andy Woodruff of Bostonography used my avl2postgis project to retrieve the data.
Tag: Lametro
Another LA Metro Visualization
Here’s another visualization of the data used in the previous post; I made the lines a lot finer, so the noise is less visible. It’s easier than ever to see the Silver Line. I classed the data manually this time.
Making Transit Travel Speed Maps with Open Source GIS
Update 2011-11-12 8:21 -0800: I just posted a visualization I like better.
The Internet has been abuzz the past week regarding transit speed maps. It seems to have been spurred by a post on Bostongraphy, which was inspired by many of the amazing visualizations produced by Eric Fischer, especially this one. Indeed, this blog has gotten a fair bit of traffic itself, because Andy Woodruff of Bostonography used my avl2postgis project to retrieve the data.
Tag: Nextbus
Another LA Metro Visualization
Here’s another visualization of the data used in the previous post; I made the lines a lot finer, so the noise is less visible. It’s easier than ever to see the Silver Line. I classed the data manually this time.
Agencies Providing Real-Time Data
As a part of the Transit Appliance Project, I’ve been evaluating what transit agencies have real-time data; here’s a (non-exhaustive) list, focused primarily on U.S. agencies (note: these are only agencies that provide an API, not any agency with a real-time feed):
- TriMet, Portland, OR, custom JSON\[-P\] feed, XML may also be available. GTFS-realtime is also available.
- San Francisco Muni, via NextBus.
- Bay Area Rapid Transit (BART), San Francisco, CA, custom XML feed. Their Google Group is very responsive and helpful. GTFS-realtime is also available.
- AC Transit, Oakland, CA, via NextBus.
- Los Angeles Metro, both via NextBus and a custom XML API.
- Unitrans, Davis, CA, via NextBus. Their GTFS is hosted by Sacramento RT.
- MBTA, via NextBus. They have a GTFS at http://www.eot.state.ma.us/developers/ that has stop ids to match NextBus. They have a trial up for rail arrivals.
- Transport for London (TfL), custom XML API.
- Washington Metropolitan Area Transit Authority (WMATA), custom XML/JSON\[-P\] API; has real time arrivals for rail, but only positions for buses (no arrivals).
- DC Circulator, via NextBus. I couldn’t find any public GTFS.
- Chicago CTA, custom XML API for buses, no arrival data for trains yet.
I know that there are a ton that aren’t on here; as I do more research, I’ll put more up.
Tag: Transit
Another LA Metro Visualization
Here’s another visualization of the data used in the previous post; I made the lines a lot finer, so the noise is less visible. It’s easier than ever to see the Silver Line. I classed the data manually this time.
Making Transit Travel Speed Maps with Open Source GIS
Update 2011-11-12 8:21 -0800: I just posted a visualization I like better.
The Internet has been abuzz the past week regarding transit speed maps. It seems to have been spurred by a post on Bostongraphy, which was inspired by many of the amazing visualizations produced by Eric Fischer, especially this one. Indeed, this blog has gotten a fair bit of traffic itself, because Andy Woodruff of Bostonography used my avl2postgis project to retrieve the data.
Transit Appliance at OSCON
If any of this blog’s readers will be attending OSCON July 25-29th in Portland, I suggest you check out the session being led by my codeveloper, Chris Smith, leader and founder of the Transit Appliance project, citizen activist and blogger extraordinaire. He’ll be talking about the open-source roots of the Transit Appliance project, and how the use of open data, hardware and software allows us to create arrival displays that are “disruptively low cost.” More information is available on the official page for the talk.
Archiving Historical Data from NextBus
It seems that everyone who analyzes historical NextBus data has a different way of archiving their data. There are lots of ways one can use GIS to analyze this data, from creating movies showing the pulse of the transit system, to analyzing on-time performance, to finding bottlenecks. In that vein, I’ve created a short Python script that fetches NextBus data and puts it into a PostGIS database for analysis. You can download the latest version here. Here’s a rundown on options:
Agencies Providing Real-Time Data
As a part of the Transit Appliance Project, I’ve been evaluating what transit agencies have real-time data; here’s a (non-exhaustive) list, focused primarily on U.S. agencies (note: these are only agencies that provide an API, not any agency with a real-time feed):
- TriMet, Portland, OR, custom JSON\[-P\] feed, XML may also be available. GTFS-realtime is also available.
- San Francisco Muni, via NextBus.
- Bay Area Rapid Transit (BART), San Francisco, CA, custom XML feed. Their Google Group is very responsive and helpful. GTFS-realtime is also available.
- AC Transit, Oakland, CA, via NextBus.
- Los Angeles Metro, both via NextBus and a custom XML API.
- Unitrans, Davis, CA, via NextBus. Their GTFS is hosted by Sacramento RT.
- MBTA, via NextBus. They have a GTFS at http://www.eot.state.ma.us/developers/ that has stop ids to match NextBus. They have a trial up for rail arrivals.
- Transport for London (TfL), custom XML API.
- Washington Metropolitan Area Transit Authority (WMATA), custom XML/JSON\[-P\] API; has real time arrivals for rail, but only positions for buses (no arrivals).
- DC Circulator, via NextBus. I couldn’t find any public GTFS.
- Chicago CTA, custom XML API for buses, no arrival data for trains yet.
I know that there are a ton that aren’t on here; as I do more research, I’ll put more up.
Tag: Losangeles
Making Transit Travel Speed Maps with Open Source GIS
Update 2011-11-12 8:21 -0800: I just posted a visualization I like better.
The Internet has been abuzz the past week regarding transit speed maps. It seems to have been spurred by a post on Bostongraphy, which was inspired by many of the amazing visualizations produced by Eric Fischer, especially this one. Indeed, this blog has gotten a fair bit of traffic itself, because Andy Woodruff of Bostonography used my avl2postgis project to retrieve the data.
Tag: Visualization
Making Transit Travel Speed Maps with Open Source GIS
Update 2011-11-12 8:21 -0800: I just posted a visualization I like better.
The Internet has been abuzz the past week regarding transit speed maps. It seems to have been spurred by a post on Bostongraphy, which was inspired by many of the amazing visualizations produced by Eric Fischer, especially this one. Indeed, this blog has gotten a fair bit of traffic itself, because Andy Woodruff of Bostonography used my avl2postgis project to retrieve the data.
Mapping Real-Time Delays: Review
Some readers may have noticed that I’ve updated my last post several times in the last few days. After thinking about the algorithms I used, I realized there were some significant issues with them. I’ve explained them a certain amount in my updates to my previous post, but I’d like to expand on the issues a bit here.
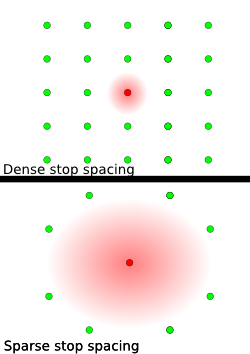
Using an Inverse Distance Weighting algorithm exaggerates delays where stops are sparse by allowing them to spread over larger areas; the graphic should make this clear; if the red dots are stops with delays, one in the city center and one in a suburb, it is clear that the delays will be magnified where stops are sparse (figure 1), because there are less stops around it.
Tag: Bing
Google Maps Tile Scales
I found this buried deep in an appendix of the Mapnik XML Schema Reference, and I thought it so useful I am reposting it here:
Zoom level Scale denominator
0
559,082,264
1
279,541,132
2
139,770,566
3
69,885,283
4
34,942,642
5
17,471,321
6
8,735,660
7
4,367,830
8
2,183,915
9
1,091,958
10
545,979
11
272,989
12
136,495
13
68,247
14
34,124
15
17,062
16
8,531
17
4,265
18
2,133
19
1,066
20
533
These are used not only by Google Maps, but also by Bing Maps, OSM, CloudMade and many others, and in fact just about any Google Mercator tile source.
Basemaps in QGIS
**Update 2012-02-02 17:57 -0800:I just wrote a post about another way to do this.
I really like QGIS. It’s a powerful GIS that runs on Linux (among other operating systems) and doesn’t require incredible amounts of CPU. One criticism I had of it was that it did not provide the same ‘click-and-go’ basemap experience one can get with ArcGIS for making simple maps (i.e. Add Basemap, select Bing, DeLorme, &c. and you’re done). No more! Thanks to the qgis-openlayers plugin available on GitHub, you can now use OSM, Google Maps, Yahoo Maps and Bing Maps as base layers in your project (side note: make sure you don’t violate any copyrights by using them). I’ve had a little trouble with the projections, but I’m not that good with dynamic reprojection in QGIS yet, so I’m sure it’s my error.; Unfortunately, the layers don’t support reprojection, so your project is basically forced to use Google Mercator—which may be a showstopper but is often acceptable for quick maps (remember, QGIS can reproject your other layers). If you do want reprojection, see this post.
Tag: Google
Google Maps Tile Scales
I found this buried deep in an appendix of the Mapnik XML Schema Reference, and I thought it so useful I am reposting it here:
Zoom level Scale denominator
0
559,082,264
1
279,541,132
2
139,770,566
3
69,885,283
4
34,942,642
5
17,471,321
6
8,735,660
7
4,367,830
8
2,183,915
9
1,091,958
10
545,979
11
272,989
12
136,495
13
68,247
14
34,124
15
17,062
16
8,531
17
4,265
18
2,133
19
1,066
20
533
These are used not only by Google Maps, but also by Bing Maps, OSM, CloudMade and many others, and in fact just about any Google Mercator tile source.
Basemaps in QGIS
**Update 2012-02-02 17:57 -0800:I just wrote a post about another way to do this.
I really like QGIS. It’s a powerful GIS that runs on Linux (among other operating systems) and doesn’t require incredible amounts of CPU. One criticism I had of it was that it did not provide the same ‘click-and-go’ basemap experience one can get with ArcGIS for making simple maps (i.e. Add Basemap, select Bing, DeLorme, &c. and you’re done). No more! Thanks to the qgis-openlayers plugin available on GitHub, you can now use OSM, Google Maps, Yahoo Maps and Bing Maps as base layers in your project (side note: make sure you don’t violate any copyrights by using them). I’ve had a little trouble with the projections, but I’m not that good with dynamic reprojection in QGIS yet, so I’m sure it’s my error.; Unfortunately, the layers don’t support reprojection, so your project is basically forced to use Google Mercator—which may be a showstopper but is often acceptable for quick maps (remember, QGIS can reproject your other layers). If you do want reprojection, see this post.
Plug: Google Fusion Tables
Google Fusion Tables is a fairly new service many may not have heard of: it lets you manage large tabular datasets in the cloud, using Google’s infrastructure. You can then visualize that data in a variety of ways, including a Google Map. The coolest feature in my mind is the ability to geocode addresses to a map on the fly. There are lots of datasets out there that, rather than providing a mappable latitude and longitude, provide an address column (or street, city, state, &c., which is easily turned into an address column using the concatenate function of your favorite spreadsheet)–many of the datasets on DataSF are like this, as are many others.
Tag: Projection
Google Maps Tile Scales
I found this buried deep in an appendix of the Mapnik XML Schema Reference, and I thought it so useful I am reposting it here:
Zoom level Scale denominator
0
559,082,264
1
279,541,132
2
139,770,566
3
69,885,283
4
34,942,642
5
17,471,321
6
8,735,660
7
4,367,830
8
2,183,915
9
1,091,958
10
545,979
11
272,989
12
136,495
13
68,247
14
34,124
15
17,062
16
8,531
17
4,265
18
2,133
19
1,066
20
533
These are used not only by Google Maps, but also by Bing Maps, OSM, CloudMade and many others, and in fact just about any Google Mercator tile source.
Tag: Tile
Google Maps Tile Scales
I found this buried deep in an appendix of the Mapnik XML Schema Reference, and I thought it so useful I am reposting it here:
Zoom level Scale denominator
0
559,082,264
1
279,541,132
2
139,770,566
3
69,885,283
4
34,942,642
5
17,471,321
6
8,735,660
7
4,367,830
8
2,183,915
9
1,091,958
10
545,979
11
272,989
12
136,495
13
68,247
14
34,124
15
17,062
16
8,531
17
4,265
18
2,133
19
1,066
20
533
These are used not only by Google Maps, but also by Bing Maps, OSM, CloudMade and many others, and in fact just about any Google Mercator tile source.
Tag: Web
Google Maps Tile Scales
I found this buried deep in an appendix of the Mapnik XML Schema Reference, and I thought it so useful I am reposting it here:
Zoom level Scale denominator
0
559,082,264
1
279,541,132
2
139,770,566
3
69,885,283
4
34,942,642
5
17,471,321
6
8,735,660
7
4,367,830
8
2,183,915
9
1,091,958
10
545,979
11
272,989
12
136,495
13
68,247
14
34,124
15
17,062
16
8,531
17
4,265
18
2,133
19
1,066
20
533
These are used not only by Google Maps, but also by Bing Maps, OSM, CloudMade and many others, and in fact just about any Google Mercator tile source.
Tag: Zoom
Google Maps Tile Scales
I found this buried deep in an appendix of the Mapnik XML Schema Reference, and I thought it so useful I am reposting it here:
Zoom level Scale denominator
0
559,082,264
1
279,541,132
2
139,770,566
3
69,885,283
4
34,942,642
5
17,471,321
6
8,735,660
7
4,367,830
8
2,183,915
9
1,091,958
10
545,979
11
272,989
12
136,495
13
68,247
14
34,124
15
17,062
16
8,531
17
4,265
18
2,133
19
1,066
20
533
These are used not only by Google Maps, but also by Bing Maps, OSM, CloudMade and many others, and in fact just about any Google Mercator tile source.
Tag: Gtfs-Realtime
Mapping Real-Time Delays: Review
Some readers may have noticed that I’ve updated my last post several times in the last few days. After thinking about the algorithms I used, I realized there were some significant issues with them. I’ve explained them a certain amount in my updates to my previous post, but I’d like to expand on the issues a bit here.
Using an Inverse Distance Weighting algorithm exaggerates delays where stops are sparse by allowing them to spread over larger areas; the graphic should make this clear; if the red dots are stops with delays, one in the city center and one in a suburb, it is clear that the delays will be magnified where stops are sparse (figure 1), because there are less stops around it.
GTFSrDB: Plumbing for GTFS-realtime
Over the last week I’ve started a new project, GTFSrDB, which allows you to connect GTFS-realtime with an SQL database, allowing app developers to use realtime data through SQL, just as easily as they use static data. Rather than worry about plumbing to connect GTFS and GTFS-realtime, they can focus on writing apps.
It accomplishes two primary tasks:
Keeping a database up-to-date with the latest realtime data, and
Archiving historic real-time data.
Tag: Database
GTFSrDB: Plumbing for GTFS-realtime
Over the last week I’ve started a new project, GTFSrDB, which allows you to connect GTFS-realtime with an SQL database, allowing app developers to use realtime data through SQL, just as easily as they use static data. Rather than worry about plumbing to connect GTFS and GTFS-realtime, they can focus on writing apps.
It accomplishes two primary tasks:
Keeping a database up-to-date with the latest realtime data, and
Archiving historic real-time data.
Tag: Gtfs
GTFSrDB: Plumbing for GTFS-realtime
Over the last week I’ve started a new project, GTFSrDB, which allows you to connect GTFS-realtime with an SQL database, allowing app developers to use realtime data through SQL, just as easily as they use static data. Rather than worry about plumbing to connect GTFS and GTFS-realtime, they can focus on writing apps.
It accomplishes two primary tasks:
Keeping a database up-to-date with the latest realtime data, and
Archiving historic real-time data.
Accessing GTFS Data in QGIS
When you load GTFS data into PostGIS using gtfsdb, you can’t access that data in QGIS because the tables don’t have a primary key in int4 format (the primary key is in text format).
If your transit system uses numeric ids in text format, an easy fix is running this against each of your tables:
ALTER TABLE stops ADD COLUMN gid int;
UPDATE stops SET gid = stop_id::int;
ALTER TABLE stops ALTER COLUMN gid SET NOT NULL;
ALTER TABLE stops ADD CONSTRAINT stops_gid_uniq UNIQUE(gid);
What this does is creates an integer ID field, populates it with the stop_id (or shape_id, &c.) cast to an integer, then adds NOT NULL and UNIQUE constraints to the column. You can’t add the constraints beforehand, because the column is initialized to NULL values. Remember you have to run these commands against every table you want to pull into QGIS directly, and remember to change stop_id to shape_id &c.
Tag: Css
Fixed-position dialogs in jQuery UI
I’m working on a project where there is a long, scrolling page and I wanted to have a dialog that is draggable and resizeable that does not scroll away when the user scrolls down. As far as I could tell, there is no option to do this with jQuery UI’s dialog widget. But there is a quick workaround:
dialogDiv.dialog().parent().css('position', 'fixed');I use the parent because the dialog widget wraps the content in another <div> that contains the content and the other elements of the dialog box (title bar, &c.).
Tag: Dialog
Fixed-position dialogs in jQuery UI
I’m working on a project where there is a long, scrolling page and I wanted to have a dialog that is draggable and resizeable that does not scroll away when the user scrolls down. As far as I could tell, there is no option to do this with jQuery UI’s dialog widget. But there is a quick workaround:
dialogDiv.dialog().parent().css('position', 'fixed');I use the parent because the dialog widget wraps the content in another <div> that contains the content and the other elements of the dialog box (title bar, &c.).
Tag: Jquery
Fixed-position dialogs in jQuery UI
I’m working on a project where there is a long, scrolling page and I wanted to have a dialog that is draggable and resizeable that does not scroll away when the user scrolls down. As far as I could tell, there is no option to do this with jQuery UI’s dialog widget. But there is a quick workaround:
dialogDiv.dialog().parent().css('position', 'fixed');I use the parent because the dialog widget wraps the content in another <div> that contains the content and the other elements of the dialog box (title bar, &c.).
Tag: Jqueryui
Fixed-position dialogs in jQuery UI
I’m working on a project where there is a long, scrolling page and I wanted to have a dialog that is draggable and resizeable that does not scroll away when the user scrolls down. As far as I could tell, there is no option to do this with jQuery UI’s dialog widget. But there is a quick workaround:
dialogDiv.dialog().parent().css('position', 'fixed');I use the parent because the dialog widget wraps the content in another <div> that contains the content and the other elements of the dialog box (title bar, &c.).
Tag: Wodget
Fixed-position dialogs in jQuery UI
I’m working on a project where there is a long, scrolling page and I wanted to have a dialog that is draggable and resizeable that does not scroll away when the user scrolls down. As far as I could tell, there is no option to do this with jQuery UI’s dialog widget. But there is a quick workaround:
dialogDiv.dialog().parent().css('position', 'fixed');I use the parent because the dialog widget wraps the content in another <div> that contains the content and the other elements of the dialog box (title bar, &c.).
Tag: Gtfsdb
Accessing GTFS Data in QGIS
When you load GTFS data into PostGIS using gtfsdb, you can’t access that data in QGIS because the tables don’t have a primary key in int4 format (the primary key is in text format).
If your transit system uses numeric ids in text format, an easy fix is running this against each of your tables:
ALTER TABLE stops ADD COLUMN gid int;
UPDATE stops SET gid = stop_id::int;
ALTER TABLE stops ALTER COLUMN gid SET NOT NULL;
ALTER TABLE stops ADD CONSTRAINT stops_gid_uniq UNIQUE(gid);
What this does is creates an integer ID field, populates it with the stop_id (or shape_id, &c.) cast to an integer, then adds NOT NULL and UNIQUE constraints to the column. You can’t add the constraints beforehand, because the column is initialized to NULL values. Remember you have to run these commands against every table you want to pull into QGIS directly, and remember to change stop_id to shape_id &c.
Tag: Postgres
Accessing GTFS Data in QGIS
When you load GTFS data into PostGIS using gtfsdb, you can’t access that data in QGIS because the tables don’t have a primary key in int4 format (the primary key is in text format).
If your transit system uses numeric ids in text format, an easy fix is running this against each of your tables:
ALTER TABLE stops ADD COLUMN gid int;
UPDATE stops SET gid = stop_id::int;
ALTER TABLE stops ALTER COLUMN gid SET NOT NULL;
ALTER TABLE stops ADD CONSTRAINT stops_gid_uniq UNIQUE(gid);
What this does is creates an integer ID field, populates it with the stop_id (or shape_id, &c.) cast to an integer, then adds NOT NULL and UNIQUE constraints to the column. You can’t add the constraints beforehand, because the column is initialized to NULL values. Remember you have to run these commands against every table you want to pull into QGIS directly, and remember to change stop_id to shape_id &c.
Tag: Conference
Transit Appliance at OSCON
If any of this blog’s readers will be attending OSCON July 25-29th in Portland, I suggest you check out the session being led by my codeveloper, Chris Smith, leader and founder of the Transit Appliance project, citizen activist and blogger extraordinaire. He’ll be talking about the open-source roots of the Transit Appliance project, and how the use of open data, hardware and software allows us to create arrival displays that are “disruptively low cost.” More information is available on the official page for the talk.
Tag: Data
Transit Appliance at OSCON
If any of this blog’s readers will be attending OSCON July 25-29th in Portland, I suggest you check out the session being led by my codeveloper, Chris Smith, leader and founder of the Transit Appliance project, citizen activist and blogger extraordinaire. He’ll be talking about the open-source roots of the Transit Appliance project, and how the use of open data, hardware and software allows us to create arrival displays that are “disruptively low cost.” More information is available on the official page for the talk.
Plug: Google Fusion Tables
Google Fusion Tables is a fairly new service many may not have heard of: it lets you manage large tabular datasets in the cloud, using Google’s infrastructure. You can then visualize that data in a variety of ways, including a Google Map. The coolest feature in my mind is the ability to geocode addresses to a map on the fly. There are lots of datasets out there that, rather than providing a mappable latitude and longitude, provide an address column (or street, city, state, &c., which is easily turned into an address column using the concatenate function of your favorite spreadsheet)–many of the datasets on DataSF are like this, as are many others.
Tag: Oscon
Transit Appliance at OSCON
If any of this blog’s readers will be attending OSCON July 25-29th in Portland, I suggest you check out the session being led by my codeveloper, Chris Smith, leader and founder of the Transit Appliance project, citizen activist and blogger extraordinaire. He’ll be talking about the open-source roots of the Transit Appliance project, and how the use of open data, hardware and software allows us to create arrival displays that are “disruptively low cost.” More information is available on the official page for the talk.
Tag: Transitappliance
Transit Appliance at OSCON
If any of this blog’s readers will be attending OSCON July 25-29th in Portland, I suggest you check out the session being led by my codeveloper, Chris Smith, leader and founder of the Transit Appliance project, citizen activist and blogger extraordinaire. He’ll be talking about the open-source roots of the Transit Appliance project, and how the use of open data, hardware and software allows us to create arrival displays that are “disruptively low cost.” More information is available on the official page for the talk.
Agencies Providing Real-Time Data
As a part of the Transit Appliance Project, I’ve been evaluating what transit agencies have real-time data; here’s a (non-exhaustive) list, focused primarily on U.S. agencies (note: these are only agencies that provide an API, not any agency with a real-time feed):
- TriMet, Portland, OR, custom JSON\[-P\] feed, XML may also be available. GTFS-realtime is also available.
- San Francisco Muni, via NextBus.
- Bay Area Rapid Transit (BART), San Francisco, CA, custom XML feed. Their Google Group is very responsive and helpful. GTFS-realtime is also available.
- AC Transit, Oakland, CA, via NextBus.
- Los Angeles Metro, both via NextBus and a custom XML API.
- Unitrans, Davis, CA, via NextBus. Their GTFS is hosted by Sacramento RT.
- MBTA, via NextBus. They have a GTFS at http://www.eot.state.ma.us/developers/ that has stop ids to match NextBus. They have a trial up for rail arrivals.
- Transport for London (TfL), custom XML API.
- Washington Metropolitan Area Transit Authority (WMATA), custom XML/JSON\[-P\] API; has real time arrivals for rail, but only positions for buses (no arrivals).
- DC Circulator, via NextBus. I couldn’t find any public GTFS.
- Chicago CTA, custom XML API for buses, no arrival data for trains yet.
I know that there are a ton that aren’t on here; as I do more research, I’ll put more up.
Tag: Avl
Archiving Historical Data from NextBus
It seems that everyone who analyzes historical NextBus data has a different way of archiving their data. There are lots of ways one can use GIS to analyze this data, from creating movies showing the pulse of the transit system, to analyzing on-time performance, to finding bottlenecks. In that vein, I’ve created a short Python script that fetches NextBus data and puts it into a PostGIS database for analysis. You can download the latest version here. Here’s a rundown on options:
Tag: Opensource
Archiving Historical Data from NextBus
It seems that everyone who analyzes historical NextBus data has a different way of archiving their data. There are lots of ways one can use GIS to analyze this data, from creating movies showing the pulse of the transit system, to analyzing on-time performance, to finding bottlenecks. In that vein, I’ve created a short Python script that fetches NextBus data and puts it into a PostGIS database for analysis. You can download the latest version here. Here’s a rundown on options:
Getting Started with Open-Source GIS: Primer
I was talking to some friends at school tonight, and I realized what a barrier it can be to actually get some of the open-source geospatial tools I’ve talked about on this blog going. So I’m going to start a series about how one can get started with these tools, from a level-zero technical knowledge (of course, I assume basic GIS knowledge—if you know what I mean when I say buffering, geocoding and vector analysis, you’re fine). I’ll be approaching it from the standpoint of a Windows user (although OS X users with Intel Macs should be able to follow the same instructions, and if you’re a Linux user, you should have no problem).
Basemaps in QGIS
**Update 2012-02-02 17:57 -0800:I just wrote a post about another way to do this.
I really like QGIS. It’s a powerful GIS that runs on Linux (among other operating systems) and doesn’t require incredible amounts of CPU. One criticism I had of it was that it did not provide the same ‘click-and-go’ basemap experience one can get with ArcGIS for making simple maps (i.e. Add Basemap, select Bing, DeLorme, &c. and you’re done). No more! Thanks to the qgis-openlayers plugin available on GitHub, you can now use OSM, Google Maps, Yahoo Maps and Bing Maps as base layers in your project (side note: make sure you don’t violate any copyrights by using them). I’ve had a little trouble with the projections, but I’m not that good with dynamic reprojection in QGIS yet, so I’m sure it’s my error.; Unfortunately, the layers don’t support reprojection, so your project is basically forced to use Google Mercator—which may be a showstopper but is often acceptable for quick maps (remember, QGIS can reproject your other layers). If you do want reprojection, see this post.
Tag: Python
Archiving Historical Data from NextBus
It seems that everyone who analyzes historical NextBus data has a different way of archiving their data. There are lots of ways one can use GIS to analyze this data, from creating movies showing the pulse of the transit system, to analyzing on-time performance, to finding bottlenecks. In that vein, I’ve created a short Python script that fetches NextBus data and puts it into a PostGIS database for analysis. You can download the latest version here. Here’s a rundown on options:
Tag: Ownership
Changing the Ownership of a WordPress Blog
Astute readers will have noticed that the author of this blog has just changed. Not to worry, it’s just an alter ego! I was doing some housekeeping to keep my various unrelated blogs straight as I move away from my other one. Here’s how I did it:
By the way, it may be useful to use two separate browsers so that you can be signed into one WordPress account in each.
Tag: Wordpress
Changing the Ownership of a WordPress Blog
Astute readers will have noticed that the author of this blog has just changed. Not to worry, it’s just an alter ego! I was doing some housekeeping to keep my various unrelated blogs straight as I move away from my other one. Here’s how I did it:
By the way, it may be useful to use two separate browsers so that you can be signed into one WordPress account in each.
Tag: 1.7
Installing QGIS-1.7 on Fedora
The QGIS instructions for building from source are targeted at Ubuntu, but they translate fairly well to Fedora. Here’s a quick guide:
Instead of preparing apt as they say, use yum or Package Manager to install these packages:
- cmake
- bison
- flex
- grass-devel
- geos-devel
- PyQt4-devel
- gsl-devel
- qwt-devel
- gdal-devel
There may be few that I already had installed on my system and missed; if you run configure below and find missing dependencies, run yum search <whatever> in a terminal to look for it. Make sure you install any relevant -devel packages as well.
Tag: Dev
Installing QGIS-1.7 on Fedora
The QGIS instructions for building from source are targeted at Ubuntu, but they translate fairly well to Fedora. Here’s a quick guide:
Instead of preparing apt as they say, use yum or Package Manager to install these packages:
- cmake
- bison
- flex
- grass-devel
- geos-devel
- PyQt4-devel
- gsl-devel
- qwt-devel
- gdal-devel
There may be few that I already had installed on my system and missed; if you run configure below and find missing dependencies, run yum search <whatever> in a terminal to look for it. Make sure you install any relevant -devel packages as well.
Tag: Fedora
Installing QGIS-1.7 on Fedora
The QGIS instructions for building from source are targeted at Ubuntu, but they translate fairly well to Fedora. Here’s a quick guide:
Instead of preparing apt as they say, use yum or Package Manager to install these packages:
- cmake
- bison
- flex
- grass-devel
- geos-devel
- PyQt4-devel
- gsl-devel
- qwt-devel
- gdal-devel
There may be few that I already had installed on my system and missed; if you run configure below and find missing dependencies, run yum search <whatever> in a terminal to look for it. Make sure you install any relevant -devel packages as well.
Tag: Qgis1.7
Installing QGIS-1.7 on Fedora
The QGIS instructions for building from source are targeted at Ubuntu, but they translate fairly well to Fedora. Here’s a quick guide:
Instead of preparing apt as they say, use yum or Package Manager to install these packages:
- cmake
- bison
- flex
- grass-devel
- geos-devel
- PyQt4-devel
- gsl-devel
- qwt-devel
- gdal-devel
There may be few that I already had installed on my system and missed; if you run configure below and find missing dependencies, run yum search <whatever> in a terminal to look for it. Make sure you install any relevant -devel packages as well.
Tag: Blogtowatch
Blog to Watch: Under Dark
If you’re interested in Open Source GIS and especially QGIS, I highly suggest you give the blog “Under Dark” a read - the author seems to be very clued in the latest developments, and the blog is very active.
Tag: Gis
Blog to Watch: Under Dark
If you’re interested in Open Source GIS and especially QGIS, I highly suggest you give the blog “Under Dark” a read - the author seems to be very clued in the latest developments, and the blog is very active.
Getting Started with Open-Source GIS: Primer
I was talking to some friends at school tonight, and I realized what a barrier it can be to actually get some of the open-source geospatial tools I’ve talked about on this blog going. So I’m going to start a series about how one can get started with these tools, from a level-zero technical knowledge (of course, I assume basic GIS knowledge—if you know what I mean when I say buffering, geocoding and vector analysis, you’re fine). I’ll be approaching it from the standpoint of a Windows user (although OS X users with Intel Macs should be able to follow the same instructions, and if you’re a Linux user, you should have no problem).
Basemaps in QGIS
**Update 2012-02-02 17:57 -0800:I just wrote a post about another way to do this.
I really like QGIS. It’s a powerful GIS that runs on Linux (among other operating systems) and doesn’t require incredible amounts of CPU. One criticism I had of it was that it did not provide the same ‘click-and-go’ basemap experience one can get with ArcGIS for making simple maps (i.e. Add Basemap, select Bing, DeLorme, &c. and you’re done). No more! Thanks to the qgis-openlayers plugin available on GitHub, you can now use OSM, Google Maps, Yahoo Maps and Bing Maps as base layers in your project (side note: make sure you don’t violate any copyrights by using them). I’ve had a little trouble with the projections, but I’m not that good with dynamic reprojection in QGIS yet, so I’m sure it’s my error.; Unfortunately, the layers don’t support reprojection, so your project is basically forced to use Google Mercator—which may be a showstopper but is often acceptable for quick maps (remember, QGIS can reproject your other layers). If you do want reprojection, see this post.
Tag: Sitetowatch
Blog to Watch: Under Dark
If you’re interested in Open Source GIS and especially QGIS, I highly suggest you give the blog “Under Dark” a read - the author seems to be very clued in the latest developments, and the blog is very active.
Tag: Underdark
Blog to Watch: Under Dark
If you’re interested in Open Source GIS and especially QGIS, I highly suggest you give the blog “Under Dark” a read - the author seems to be very clued in the latest developments, and the blog is very active.
Tag: Basics
Getting Started with Open-Source GIS: Primer
I was talking to some friends at school tonight, and I realized what a barrier it can be to actually get some of the open-source geospatial tools I’ve talked about on this blog going. So I’m going to start a series about how one can get started with these tools, from a level-zero technical knowledge (of course, I assume basic GIS knowledge—if you know what I mean when I say buffering, geocoding and vector analysis, you’re fine). I’ll be approaching it from the standpoint of a Windows user (although OS X users with Intel Macs should be able to follow the same instructions, and if you’re a Linux user, you should have no problem).
Tag: Mapping
Getting Started with Open-Source GIS: Primer
I was talking to some friends at school tonight, and I realized what a barrier it can be to actually get some of the open-source geospatial tools I’ve talked about on this blog going. So I’m going to start a series about how one can get started with these tools, from a level-zero technical knowledge (of course, I assume basic GIS knowledge—if you know what I mean when I say buffering, geocoding and vector analysis, you’re fine). I’ll be approaching it from the standpoint of a Windows user (although OS X users with Intel Macs should be able to follow the same instructions, and if you’re a Linux user, you should have no problem).
Tag: Osgeo
Getting Started with Open-Source GIS: Primer
I was talking to some friends at school tonight, and I realized what a barrier it can be to actually get some of the open-source geospatial tools I’ve talked about on this blog going. So I’m going to start a series about how one can get started with these tools, from a level-zero technical knowledge (of course, I assume basic GIS knowledge—if you know what I mean when I say buffering, geocoding and vector analysis, you’re fine). I’ll be approaching it from the standpoint of a Windows user (although OS X users with Intel Macs should be able to follow the same instructions, and if you’re a Linux user, you should have no problem).
Tag: Maps
Basemaps in QGIS
**Update 2012-02-02 17:57 -0800:I just wrote a post about another way to do this.
I really like QGIS. It’s a powerful GIS that runs on Linux (among other operating systems) and doesn’t require incredible amounts of CPU. One criticism I had of it was that it did not provide the same ‘click-and-go’ basemap experience one can get with ArcGIS for making simple maps (i.e. Add Basemap, select Bing, DeLorme, &c. and you’re done). No more! Thanks to the qgis-openlayers plugin available on GitHub, you can now use OSM, Google Maps, Yahoo Maps and Bing Maps as base layers in your project (side note: make sure you don’t violate any copyrights by using them). I’ve had a little trouble with the projections, but I’m not that good with dynamic reprojection in QGIS yet, so I’m sure it’s my error.; Unfortunately, the layers don’t support reprojection, so your project is basically forced to use Google Mercator—which may be a showstopper but is often acceptable for quick maps (remember, QGIS can reproject your other layers). If you do want reprojection, see this post.
Plug: Google Fusion Tables
Google Fusion Tables is a fairly new service many may not have heard of: it lets you manage large tabular datasets in the cloud, using Google’s infrastructure. You can then visualize that data in a variety of ways, including a Google Map. The coolest feature in my mind is the ability to geocode addresses to a map on the fly. There are lots of datasets out there that, rather than providing a mappable latitude and longitude, provide an address column (or street, city, state, &c., which is easily turned into an address column using the concatenate function of your favorite spreadsheet)–many of the datasets on DataSF are like this, as are many others.
Tag: Yahoo
Basemaps in QGIS
**Update 2012-02-02 17:57 -0800:I just wrote a post about another way to do this.
I really like QGIS. It’s a powerful GIS that runs on Linux (among other operating systems) and doesn’t require incredible amounts of CPU. One criticism I had of it was that it did not provide the same ‘click-and-go’ basemap experience one can get with ArcGIS for making simple maps (i.e. Add Basemap, select Bing, DeLorme, &c. and you’re done). No more! Thanks to the qgis-openlayers plugin available on GitHub, you can now use OSM, Google Maps, Yahoo Maps and Bing Maps as base layers in your project (side note: make sure you don’t violate any copyrights by using them). I’ve had a little trouble with the projections, but I’m not that good with dynamic reprojection in QGIS yet, so I’m sure it’s my error.; Unfortunately, the layers don’t support reprojection, so your project is basically forced to use Google Mercator—which may be a showstopper but is often acceptable for quick maps (remember, QGIS can reproject your other layers). If you do want reprojection, see this post.
Tag: Cloud
Plug: Google Fusion Tables
Google Fusion Tables is a fairly new service many may not have heard of: it lets you manage large tabular datasets in the cloud, using Google’s infrastructure. You can then visualize that data in a variety of ways, including a Google Map. The coolest feature in my mind is the ability to geocode addresses to a map on the fly. There are lots of datasets out there that, rather than providing a mappable latitude and longitude, provide an address column (or street, city, state, &c., which is easily turned into an address column using the concatenate function of your favorite spreadsheet)–many of the datasets on DataSF are like this, as are many others.
Tag: Datasf
Plug: Google Fusion Tables
Google Fusion Tables is a fairly new service many may not have heard of: it lets you manage large tabular datasets in the cloud, using Google’s infrastructure. You can then visualize that data in a variety of ways, including a Google Map. The coolest feature in my mind is the ability to geocode addresses to a map on the fly. There are lots of datasets out there that, rather than providing a mappable latitude and longitude, provide an address column (or street, city, state, &c., which is easily turned into an address column using the concatenate function of your favorite spreadsheet)–many of the datasets on DataSF are like this, as are many others.
Tag: Fusiontables
Plug: Google Fusion Tables
Google Fusion Tables is a fairly new service many may not have heard of: it lets you manage large tabular datasets in the cloud, using Google’s infrastructure. You can then visualize that data in a variety of ways, including a Google Map. The coolest feature in my mind is the ability to geocode addresses to a map on the fly. There are lots of datasets out there that, rather than providing a mappable latitude and longitude, provide an address column (or street, city, state, &c., which is easily turned into an address column using the concatenate function of your favorite spreadsheet)–many of the datasets on DataSF are like this, as are many others.
Tag: Geocoding
Plug: Google Fusion Tables
Google Fusion Tables is a fairly new service many may not have heard of: it lets you manage large tabular datasets in the cloud, using Google’s infrastructure. You can then visualize that data in a variety of ways, including a Google Map. The coolest feature in my mind is the ability to geocode addresses to a map on the fly. There are lots of datasets out there that, rather than providing a mappable latitude and longitude, provide an address column (or street, city, state, &c., which is easily turned into an address column using the concatenate function of your favorite spreadsheet)–many of the datasets on DataSF are like this, as are many others.
Tag: List
Agencies Providing Real-Time Data
As a part of the Transit Appliance Project, I’ve been evaluating what transit agencies have real-time data; here’s a (non-exhaustive) list, focused primarily on U.S. agencies (note: these are only agencies that provide an API, not any agency with a real-time feed):
- TriMet, Portland, OR, custom JSON\[-P\] feed, XML may also be available. GTFS-realtime is also available.
- San Francisco Muni, via NextBus.
- Bay Area Rapid Transit (BART), San Francisco, CA, custom XML feed. Their Google Group is very responsive and helpful. GTFS-realtime is also available.
- AC Transit, Oakland, CA, via NextBus.
- Los Angeles Metro, both via NextBus and a custom XML API.
- Unitrans, Davis, CA, via NextBus. Their GTFS is hosted by Sacramento RT.
- MBTA, via NextBus. They have a GTFS at http://www.eot.state.ma.us/developers/ that has stop ids to match NextBus. They have a trial up for rail arrivals.
- Transport for London (TfL), custom XML API.
- Washington Metropolitan Area Transit Authority (WMATA), custom XML/JSON\[-P\] API; has real time arrivals for rail, but only positions for buses (no arrivals).
- DC Circulator, via NextBus. I couldn’t find any public GTFS.
- Chicago CTA, custom XML API for buses, no arrival data for trains yet.
I know that there are a ton that aren’t on here; as I do more research, I’ll put more up.
Tag: Realtime
Agencies Providing Real-Time Data
As a part of the Transit Appliance Project, I’ve been evaluating what transit agencies have real-time data; here’s a (non-exhaustive) list, focused primarily on U.S. agencies (note: these are only agencies that provide an API, not any agency with a real-time feed):
- TriMet, Portland, OR, custom JSON\[-P\] feed, XML may also be available. GTFS-realtime is also available.
- San Francisco Muni, via NextBus.
- Bay Area Rapid Transit (BART), San Francisco, CA, custom XML feed. Their Google Group is very responsive and helpful. GTFS-realtime is also available.
- AC Transit, Oakland, CA, via NextBus.
- Los Angeles Metro, both via NextBus and a custom XML API.
- Unitrans, Davis, CA, via NextBus. Their GTFS is hosted by Sacramento RT.
- MBTA, via NextBus. They have a GTFS at http://www.eot.state.ma.us/developers/ that has stop ids to match NextBus. They have a trial up for rail arrivals.
- Transport for London (TfL), custom XML API.
- Washington Metropolitan Area Transit Authority (WMATA), custom XML/JSON\[-P\] API; has real time arrivals for rail, but only positions for buses (no arrivals).
- DC Circulator, via NextBus. I couldn’t find any public GTFS.
- Chicago CTA, custom XML API for buses, no arrival data for trains yet.
I know that there are a ton that aren’t on here; as I do more research, I’ll put more up.