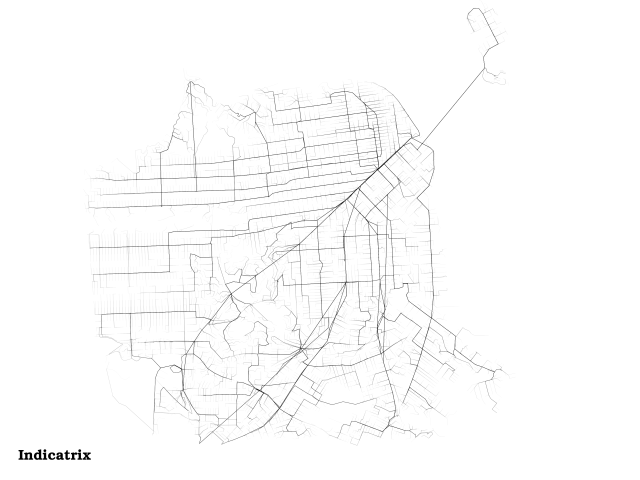
Transit to Everywhere
 Data courtesy MapQuest and OpenStreetMap CC-BY-SA, the City and County of San Francisco, and Bay Area Rapid Transit
This is an overlay of the transit and walking trip plans generated by OpenTripPlanner from Powell and Market to every other intersection in San Francisco, after Eric Fischer’s map of walking routes to every intersection in San Francisco. It brings out the transit routes but also shows well-used walking routes. The lines do not vary in width (don’t let Market Street fool you, it’s actually several lines—BART, MUNI rail in 2 directions, Muni bus, walking—very near each other). The lines fade where there are fewer routes using them, because they are rendered as black set at 10% opacity. Where there are more lines overlapping, the lines become darker, in what I believe is a log (or log-like) scale. It ended up just mostly being a map of San Francisco, with transit routes emphasized. It doesn’t show potential utilization of the transit system, because the routes are not weighted (it would probably be wise to weight the routes by the density of the block they terminate in and by their service area; i.e., estimate the number of people within the Thiessen polygon of each intersection and weight the route by that). Also, I had difficulty finding an opacity level where the usage of transit routes fades towards the end (as it clearly should) but still shows the streets that walked down by just one or two trip plans.
I think the data I used to make this map could possibly be better utilized to make a cartogram of San Francisco transit times ( like another of Eric Fischer’s maps, but including transfers and walking times).
I’d also like to make a companion map using the OTP bike router. I think it could look really interesting in San Francisco, because the router will try to avoid hills.
Methodology
I set up an instance of OpenTripPlanner using a graph built from OpenStreetMap data for the San Francisco area, as well as GTFS data from BART and San Francisco Muni. I used the pre-built binaries of OTP. I then used a Python script to request directions from Market and Powell to every other intersection in San Francisco, as defined in the StIntersections dataset from here. I stored the directions in a PostGIS database. I used one machine as the OTP server, and ran the script and PostGIS on another machine, but I see no reason why they couldn’t be on the same machine. I used QGIS to render the map. For what it’s worth, I’ve open-sourced the script I wrote. It may provide a good example of how to use the OTP JSON API in Python.