Below you will find pages that utilize the taxonomy term “Osm”
Conditional Labels in QGIS
I fairly commonly find myself in a situation where I would like to display one label for certain features and another for other features in the same layer. QGIS doesn’t have an official way to split labels up into categories, and until now I’d resorted to having two layers to render otherwise identical features. But, in the new, excellent expression based labeling from Nathan Woodrow, I realized one can use an SQL CASE statement. For instance, one time I need to use two types labels is when labeling roads in OpenStreetMap: I want to use the name tag, unless the feature has a ref tag defined (a name tag might be ‘Capital City Freeway’, while the ref tag would be ‘US 50’). Here’s how I solved that particular problem:
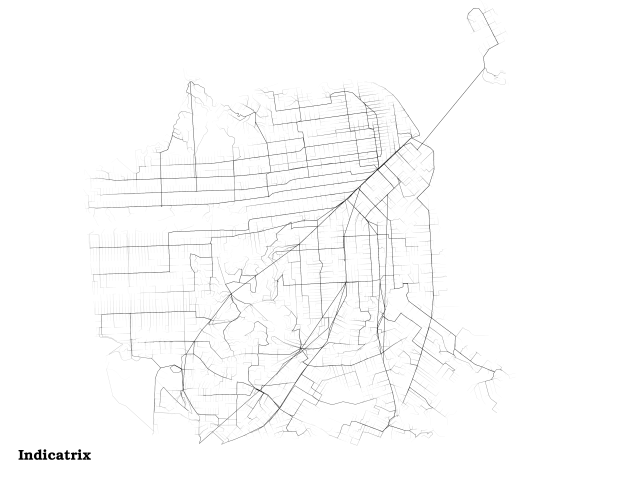
Transit to Everywhere
 Data courtesy MapQuest and OpenStreetMap CC-BY-SA, the City and County of San Francisco, and Bay Area Rapid Transit
This is an overlay of the transit and walking trip plans generated by OpenTripPlanner from Powell and Market to every other intersection in San Francisco, after Eric Fischer’s map of walking routes to every intersection in San Francisco. It brings out the transit routes but also shows well-used walking routes. The lines do not vary in width (don’t let Market Street fool you, it’s actually several lines—BART, MUNI rail in 2 directions, Muni bus, walking—very near each other). The lines fade where there are fewer routes using them, because they are rendered as black set at 10% opacity. Where there are more lines overlapping, the lines become darker, in what I believe is a log (or log-like) scale. It ended up just mostly being a map of San Francisco, with transit routes emphasized. It doesn’t show potential utilization of the transit system, because the routes are not weighted (it would probably be wise to weight the routes by the density of the block they terminate in and by their service area; i.e., estimate the number of people within the Thiessen polygon of each intersection and weight the route by that). Also, I had difficulty finding an opacity level where the usage of transit routes fades towards the end (as it clearly should) but still shows the streets that walked down by just one or two trip plans.
Google Maps Tile Scales
I found this buried deep in an appendix of the Mapnik XML Schema Reference, and I thought it so useful I am reposting it here:
Zoom level Scale denominator
0
559,082,264
1
279,541,132
2
139,770,566
3
69,885,283
4
34,942,642
5
17,471,321
6
8,735,660
7
4,367,830
8
2,183,915
9
1,091,958
10
545,979
11
272,989
12
136,495
13
68,247
14
34,124
15
17,062
16
8,531
17
4,265
18
2,133
19
1,066
20
533
These are used not only by Google Maps, but also by Bing Maps, OSM, CloudMade and many others, and in fact just about any Google Mercator tile source.