Statistics for travel behavior
In fall 2019, I co-taught a seminar on how people’s attitudes affect their travel behavior. As part of this seminar, I gave a crash course in statistics for travel behavior, covering topics including linear regression, factor analysis, discrete choice models, count models, and structural equation models. I created a comprehensive slide deck with visual demonstrations of these model forms.
The goal of this course was not to teach students how to fit these models, but to give students an understanding of what model forms are out there, when it is appropriate to use them, and how to interpret their results.
The slides are available as PDF or as LaTeX source.
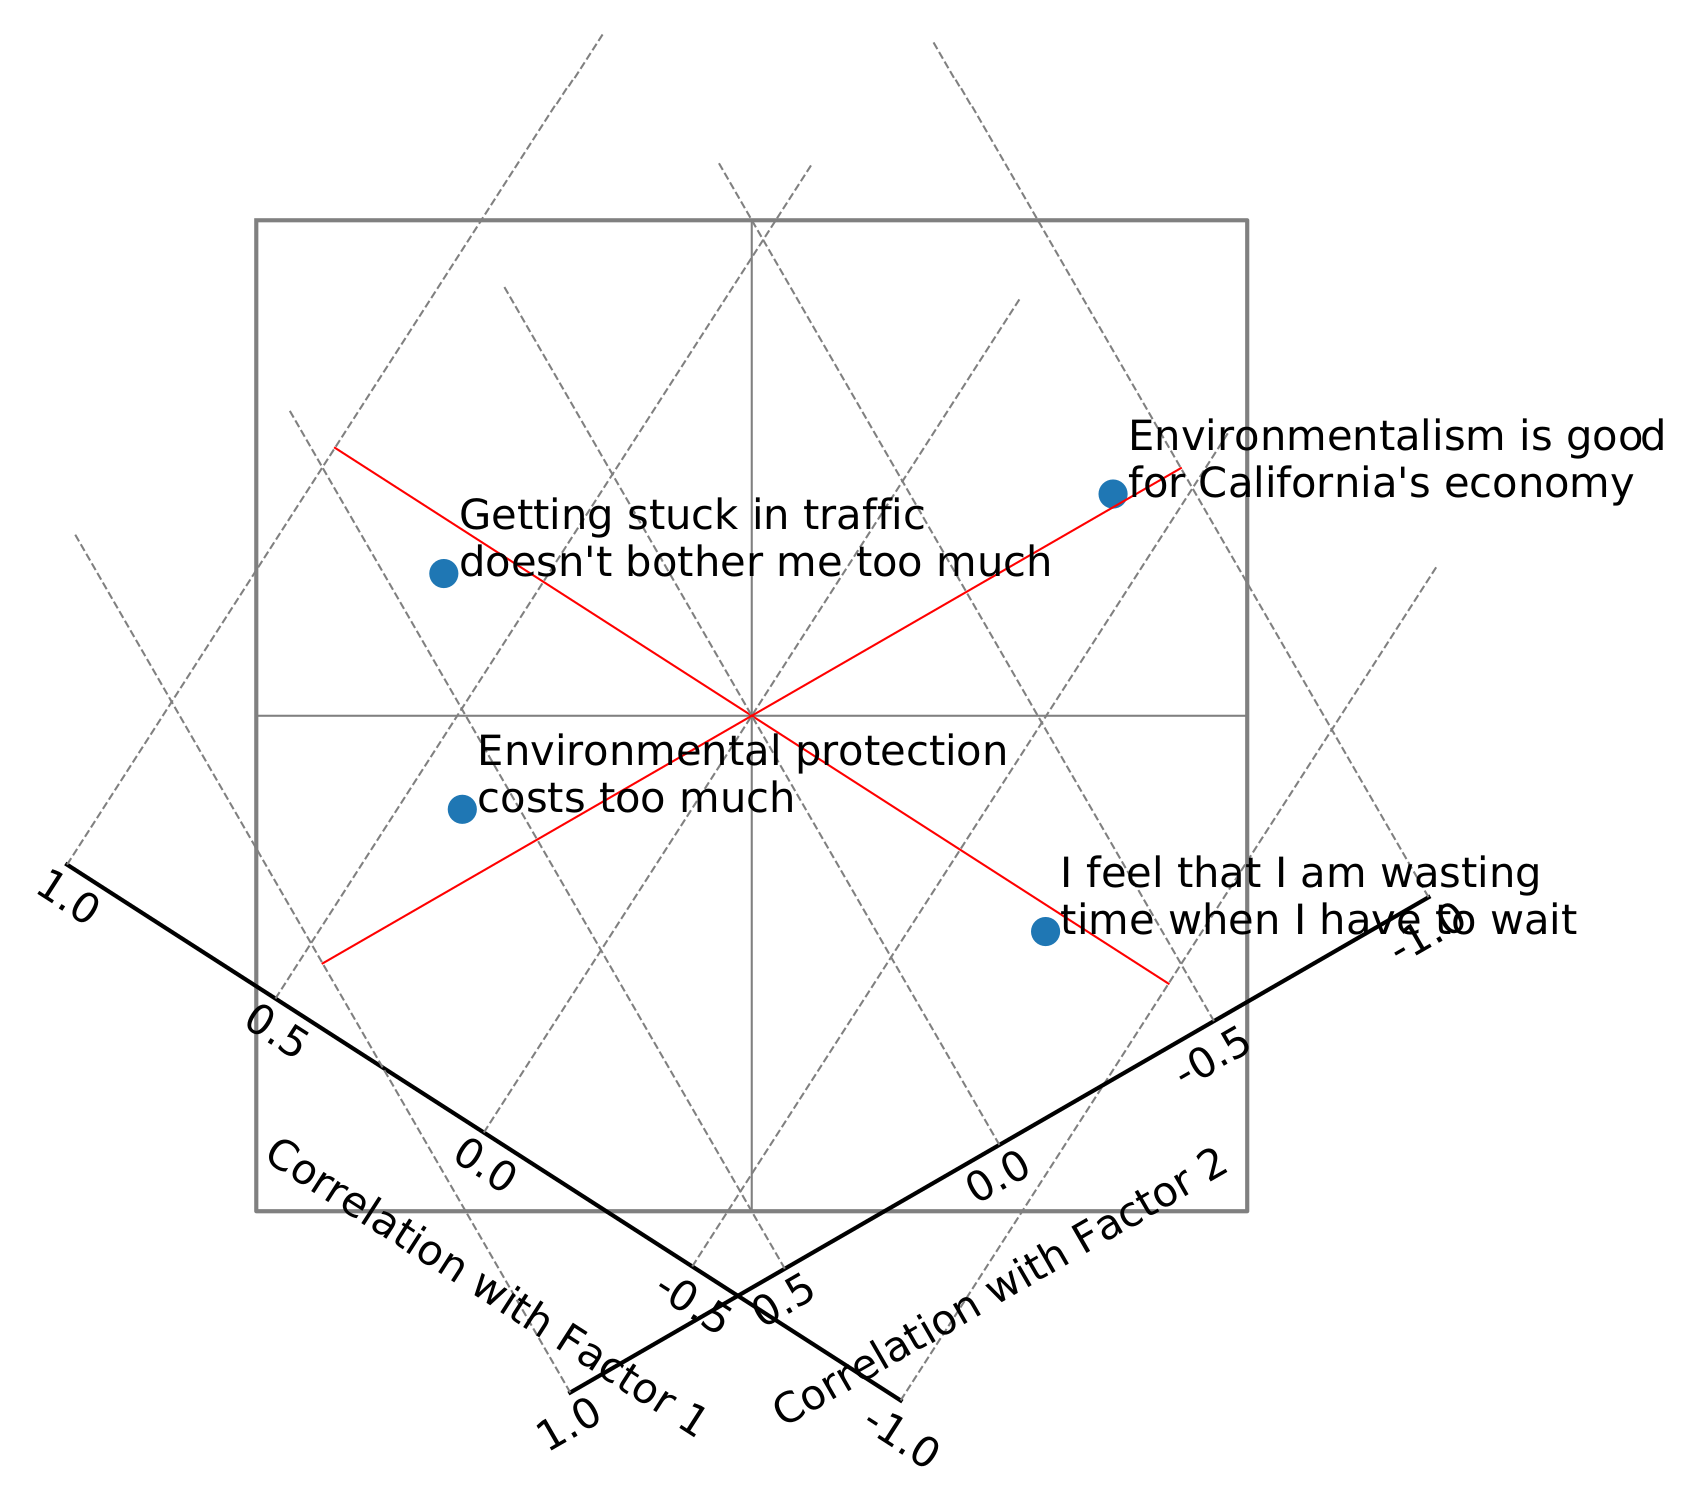
Visualizing the structure matrix of an oblique factor analysis rotation, from the slide deck.
I am licensing these slides under a Creative Commons Attribution 4.0 license—basically, you’re free to use these slides as you see fit as long as you attribute them back to me. While you’re by no means obligated to, if you do use some portion of these in your own teaching, I’d love it if you’d drop me a line.
These slides were created with support from the Center for Teaching Old Models New Tricks at Arizona State University, a University Transportation Center funded by the United States Department of Transportation.