Overanalyzing Board Games: Network Analysis and Pandemic
mattwigway
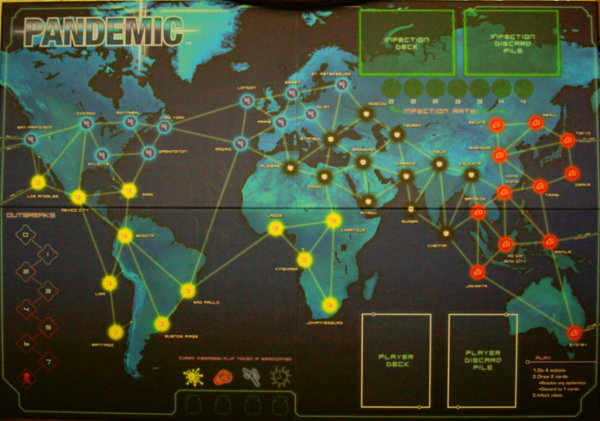
I like board games, and one of my favorites is Pandemic. The game consists of a board (pictured above) with a world map on it, with various cities highlighted, and a network between the cities. Disease breaks out randomly in the cities at the start of the game (using the shuffled infection deck) and then progresses using the same deck. Players cooperatively attempt to quell disease by moving between cities and treating disease. On each turn, players draw city cards; by collecting five of a particular color, they can cure a disease. Additional cards are drawn each turn from the infection deck to infect additional cities. Periodically, there are ’epidemics’ in which the cards for the cities that have already been drawn are returned to the top of the infection deck. If a city is infected three times without being treated, and there is an additional infection, an ‘outbreak’ occurs and all of the cities connected to that city are infected.
The network is a major component of gameplay, so it seemed like network theory would be able to shed some light on a strategy for the game. I digitized the network from the game board using Gephi. I then calculated the Eigenvector centrality and degree for each city using NetworkX. A machine-readable graph is available for download.
Both degree and Eigenvector centrality are measures of centrality, that is how central a node is in the network. Degree is the simpler of the two; it is the number of connections (edges) each city (node) has. For example, Santiago is connected to only one city (Lima), so it has degree 1. Chicago is connected to five other cities (San Francisco, Los Angeles, Mexico City, Atlanta, and Montréal), so it has degree 5. The more other places a city is connected to, the theory goes, the more important it is.
Eigenvector centrality is a bit more complicated, but not much. As explained by Wikipedia, the centrality of each node is the scaled sum of the centralities of the nodes around it. As it happens, this is also the eigenvector of the adjacency matrix, hence the name. This measure of centrality takes into account not only the number of connections of a city, but the number of connections of each of the cities it is connected to, and so on.
Degree and eigenvector centrality are both theoretically applicable to different parts of gameplay. Degree is most important for preventing outbreaks. Except in rare double outbreaks (when an outbreak in one city causes an outbreak in a connected city), the severity of an outbreak is defined by the degree of the city in which it occurs. If there have been three infections in a city with a high degree, the players would be wise to treat that city ASAP.
Eigenvector centrality is more useful for building research stations. Throughout the game, the players can build research stations, which have multiple uses. The most important from a graph-theoretic standpoint is that players can move from research station to research station as if there were an edge between them. Thus, cities with research stations are much more accessible to players. If research stations are built in cities with high eigenvector centrality, the number of cities that can be reached will be maximized (i.e., one could go to the research station, and then to an adjacent city, and then to another adjacent city; the possibilities are maximized with research stations in cities with high eigenvector centrality). There are caveats, of course; Bangkok and Hong Kong both have high eigenvector centrality, but it probably wouldn’t make sense to build research stations in both cities as they are adjacent to each other.
The real question is whether this is useful for gameplay. Unfortunately I haven’t played the game since I’ve made these calculations, but it initially seems that the centrality measures confirm what most players had already figured out: building research stations and treating disease is most important in the most-connected cities.
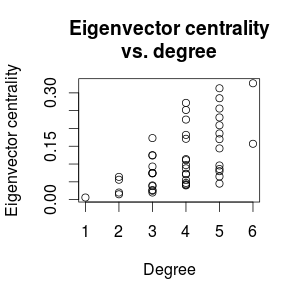
While most players don’t think about (let alone calculate) eigenvector centrality during gameplay, they probably have thought about the degree of each city (if not by that name). As it turns out, degree and eigenvector centrality are fairly correlated (see scatterplot at right, made with R; correlation coefficient 0.58), so simply looking at degree gives one a fairly good picture of the centrality of a city.
Realistically, these measures of centrality don’t determine the absolute best strategy. Games tend to played out in a relatively small subset of the cities on the board, because each time there is an epidemic the cities already infected are placed back on the top of the deck to be infected again. Cities near the bottom of the deck rarely if ever come up. If there are no infections in Asia, it is likely not worth the effort to build research stations there despite the high centrality of many of the Asian cities. Building research stations is constrained by the cards each player has and the need to balance research station construction with other tasks such as treating disease.
One interesting pattern in the centralities is that Asian cities have very high centralities, while cities in the global South are much less central. This suggests that disease can spread much more rapidly in the Asian cities (although this is somewhat counterbalanced by increased ability to reach the Asian cities from each other). Gameplay is very different when focused on the Asian cities than when focused on the global South. I have noticed this in gameplay (infections in the South don’t seem to cause as much trouble as other infections, though this is admittedly anecdotal). The centralities provide some theoretical justification for this observation.
One further analysis that could be undertaken would be to treat all research station-to-research station links as additional edges in the network, and determine which combinations of cities reduce the average shortest path distance between all pairs of nodes.
And finally, the centralities:
| City | Eigenvector centrality | Degree |
| Hong Kong | 0.327 | 6 |
| Bangkok | 0.313 | 5 |
| Chennai | 0.285 | 5 |
| Kolkata | 0.272 | 4 |
| Delhi | 0.256 | 5 |
| Ho Chi Minh City | 0.252 | 4 |
| Manila | 0.231 | 5 |
| Jakarta | 0.225 | 4 |
| Karachi | 0.209 | 5 |
| Baghdad | 0.186 | 5 |
| Taipei | 0.182 | 4 |
| Mumbai | 0.173 | 3 |
| Tehran | 0.171 | 4 |
| Shanghai | 0.170 | 5 |
| Istanbul | 0.157 | 6 |
| Cairo | 0.144 | 5 |
| Sydney | 0.125 | 3 |
| Riyadh | 0.124 | 3 |
| San Francisco | 0.114 | 4 |
| Algiers | 0.111 | 4 |
| Tokyo | 0.097 | 4 |
| Paris | 0.096 | 5 |
| Moscow | 0.093 | 3 |
| Los Angeles | 0.088 | 4 |
| Madrid | 0.086 | 5 |
| Chicago | 0.080 | 5 |
| Milan | 0.075 | 3 |
| Seoul | 0.074 | 3 |
| St. Petersburg | 0.074 | 3 |
| Essen | 0.073 | 4 |
| London | 0.071 | 4 |
| Mexico City | 0.065 | 5 |
| Osaka | 0.064 | 2 |
| Beijing | 0.056 | 2 |
| New York | 0.055 | 4 |
| Khartoum | 0.047 | 4 |
| Bogotá | 0.045 | 5 |
| Miami | 0.043 | 4 |
| Washington | 0.041 | 4 |
| São Paulo | 0.040 | 4 |
| Montréal | 0.040 | 3 |
| Atlanta | 0.038 | 3 |
| Lima | 0.027 | 3 |
| Lagos | 0.025 | 3 |
| Kinshasa | 0.020 | 3 |
| Buenos Aires | 0.020 | 2 |
| Johannesburg | 0.015 | 2 |
| Santiago | 0.006 | 1 |