How transit fares affect accessibility
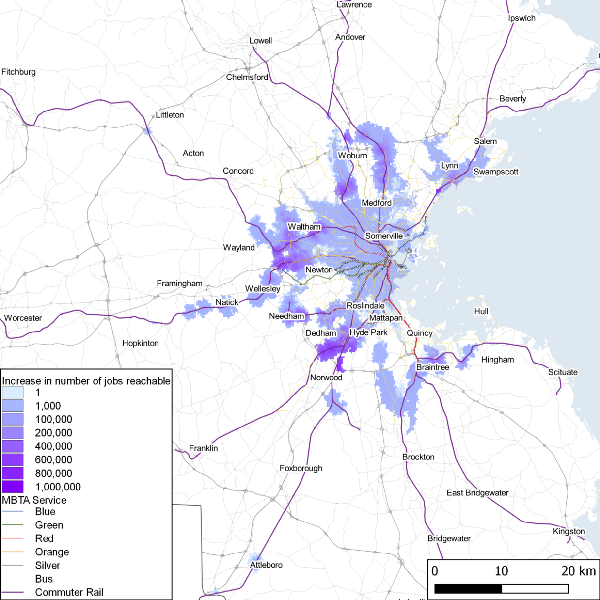 Change in job accessibility with 60 minute travel time budget and $5 fare, if fares on the commuter rail were reduced
Accessibility metrics are increasingly being used for planning, with planning agencies measuring what opportunities the transportation network connects residents to. A common accessibility metric is the “cumulative opportunities” metric, which measures how many opportunities can be reached within a given travel time budget—these opportunities could be jobs, grocery stores, or even abstract space. Furthermore, accessibility is frequently invoked in discussions of just transportation systems. Karel Martens and Rafael H.M. Pereira both argue that just transport systems should provide a baseline level of access to all individuals.
However, in the case of public transportation, travel time is not the only cost that travelers incur. Transit users in most transit systems must also pay a fare, which makes any access provided by the system meaningful only if the users can afford the fare. In our recently-published article in the International Journal of Geographic Information Science, Anson Stewart and I extend cumulative opportunity accessibility metrics to account for opportunities that are reachable within a travel time budget and a monetary cost budget ( publisher version of paper, open access preprint).
The key challenge with using transit fares as a cutoff in the accessibility metric is path-dependence. While travel time is not path dependent—it takes the same amount of time to go a few stops on a bus whether you got to the stop via another bus, a train, or a silly walk—the same is not true of fares. A bus might yield a free transfer to another bus, while the train does not. Knowing whether the bus is better in terms of fare than the train at an intermediate point requires knowing not only the cost of the bus, but also the full journey cost for all journeys that begin with the bus. To produce a tractable algorithm, it is important to be able to discard suboptimal routes within the algorithm, before the computer has spent large amounts of time evaluating them.
Our algorithm accounts for this difficulty by tracking the “transfer allowance” of each transit option—how much a system user could save on a subsequent vehicle if they access it via a particular option. We can thus discard many journeys that provably cannot result in an optimal trip, while retaining journeys that may. We implemented the algorithm in Conveyal’s R5 analysis engine (I began this work while a Conveyal employee, though I’ve since moved to Arizona State University, and Anson works for Conveyal now). Case study results are in the next section.
We’re not the first team to tackle this problem. A team led by Ahmed El-Geneidy used a similar metric, but relied on a fare computed for only the fastest trip. If there is, say, a fast commuter train paralleled by a slower but cheaper local bus, this approach may find that a destination is unreachable given the fare constraints; the cheaper but slower bus may not be considered. A team led by Hong K. Lo developed an algorithm that can correctly account for fares, but it requires pre-specifying allowable sequences of modes, non-ideal for accessibility metrics since one of their key selling points is a relative lack of behavioral assumptions.
We demonstrate our algorithm with a case study in the Boston area. Boston’s transit agency, the MBTA, has a complex fare structure, with flat fares differentiated by route type, zone-based fares on commuter rail, and a variety of discounted transfers. Just as important, the effect of fare policy on low-income travelers’ accessibility has been a salient topic in Boston politics since at least the 1940’s, when the protest song “M.T.A.” was written in support of a mayoral candidate. One verse in the song notes that the subway fare increase will prevent the protagonist, Charlie, from experiencing affordable access to visit his “sister in Chelsea, or [his] cousin in Roxbury.”
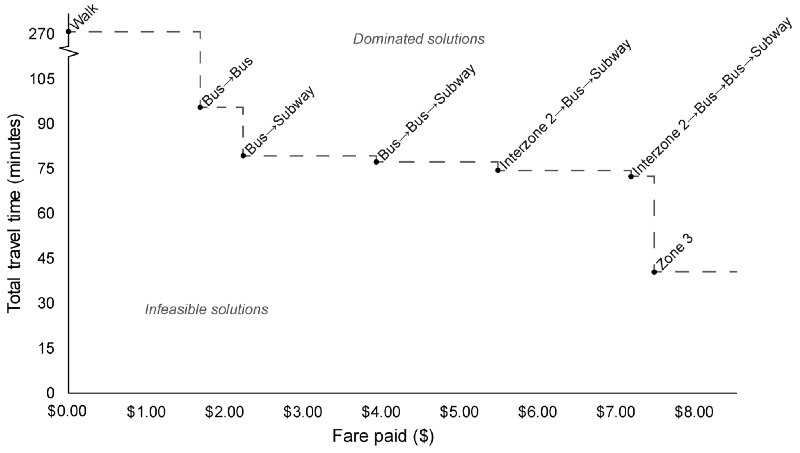
The image above shows the range of tradeoffs between travel time and fare, for trips between suburban Norwood and central Copley Square. (Technically, the image shows a Pareto frontier.) The fastest route is to use the commute rail system, and pay a $7.50 Zone 3 fare to reach Back bay then walk to Copley in about 40 minutes total. However, a budget-constrained traveler might instead choose to to take a bus to the subway for $2.25, or a bus to another bus for $1.70, and endure 75–95 minutes of travel time. Or they may choose a middle option: taking commuter rail, but disembarking before Back Bay and transfering to a bus and then the subway, requiring an hour of travel time but costing only $5.50.
Boston’s rail system consists of a mix of light- and heavy-rail rapid transit, and commuter rail. The rapid transit system has a flat $2.25 fare, while the commuter rail system has a zone-based fare and is far more expensive. While the rapid transit system generally serves only the inner portions of the region, while the commuter rail system stretches far into the suburbs. However, some inner neighborhoods, even within the City of Boston proper, are served by commuter rail and not by rapid transit, producing a fare differential for travel from neighborhoods that are similar in terms of function in the metropolitan structure. Thus, we compare the current fare system to a system where travel between all Zone 1A, 1, and 2 commuter rail stations (the innermost zones) costs a flat $2.25. We do not claim that this scenario is sound policy or would have beneficial ridership or fiscal impacts; it is only intended to demonstrate the characteristics of our algorithm.

The map at left shows the effect this scenario would have on accessibility to jobs with a 60 minute travel time limit and a $5 fare limit. Note that this scenario makes no changes to the transit schedules; all changes are due to lowered fares making more jobs accessible within the $5 fare limit. The largest increases are near commuter rail stations experiencing lowered fares (e.g. near Dedham, Newton, Lynn and south of Woburn), because of cheaper access to centrally-located jobs in Boston. However, there are also increases far from commuter rail, due to network effects—it is now possible to ride another form of transit to access commuter rail and then travel via commuter rail to both downtown and suburban jobs, without exceeding a $5 fare. This demonstrates the value of using accessibility metrics to evaluate fare policy—the impacts extend far beyond the stations affected.
If you’ve made it this far, you may want to read the full paper. It’s available from the publisher (paywalled), or for free on this site, without the fancy journal formatting.
Matthew Wigginton Conway
PhD Candidate in the School of Geographical Sciences and Urban Planning, Arizona State University
I am PhD Candidate in Geography at Arizona State University, where I research how zoning codes influence transport outcomes.